Most retailers measure employee engagement with one annual survey. It produces a number, the number lands in a slide deck, and nothing operational changes. By the time the next survey runs, the data is twelve months old and the disengaged associates have already left.
This piece lays out a modern framework for measuring retail employee engagement, built on research from Gallup, Workhuman, Engage for Success, the Work Institute, and Qualtrics. It covers what to measure, how often to measure it, and how to turn engagement data into operational decisions that affect store performance.

How to measure retail employee engagement
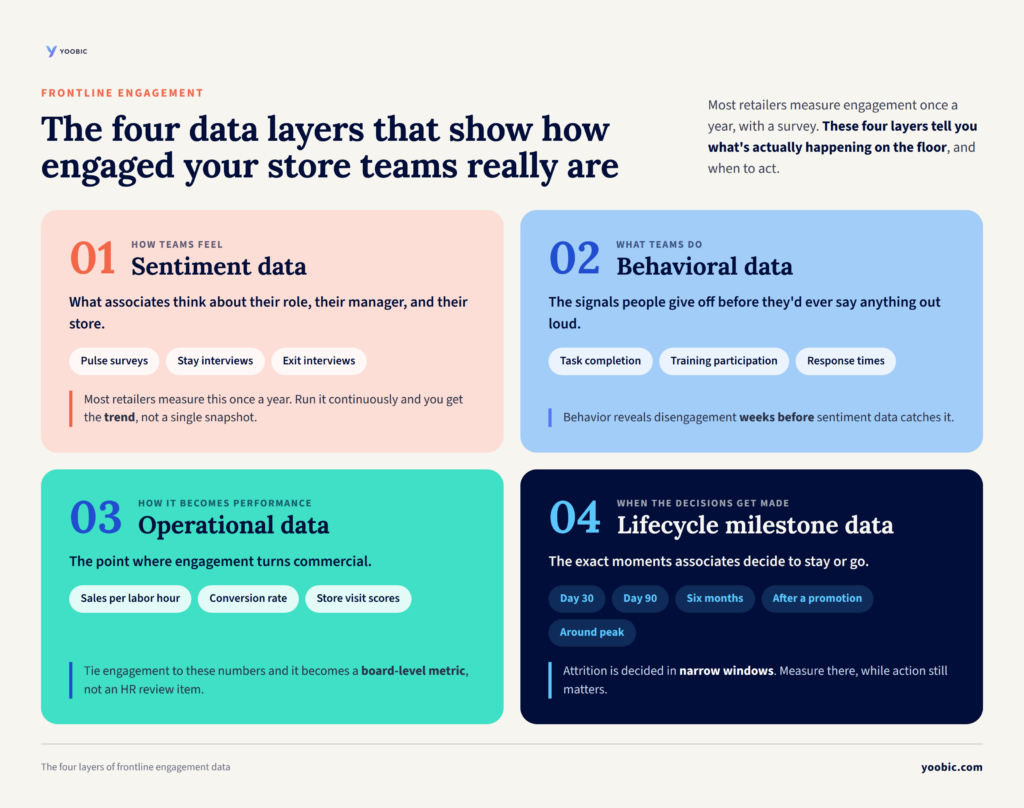
Modern retail engagement measurement combines four data layers rather than relying on a single survey. Sentiment data comes from pulse surveys, stay interviews, and exit interviews. Behavioral data comes from task completion, training participation, and communication response times. Operational data comes from sales per labor hour, customer compliments, and store visit scores. Lifecycle milestone data comes from key tenure points, including day 30, day 90, six months, post-promotion, and peak periods. Used together, these four layers can predict turnover with up to 85% accuracy. Used alone, an annual survey misses most of the signal.
Why engagement measurement breaks down in most stores
The annual engagement survey is the dominant measurement tool in retail, and it’s the wrong one for three reasons.
The first problem is cadence. By the time an annual survey is fielded, analyzed, and reported, the data is already old. The associates who responded are no longer the same associates on the floor, and the conditions they described no longer match the conditions in front of you.
The second problem is format. Surveys produce sentiment scores, not operational signals. A 72% engagement score tells you nothing about which store, which behavior, or which intervention to fix. The score sits inside HR while the action sits inside operations, so the data never makes the trip between them.
The third problem is relying on a single layer. Most retailers measure sentiment and ignore the other three. Behavioral, operational, and lifecycle data all carry stronger predictive signals than sentiment does. Used together, they predict turnover with up to 85% accuracy. Used alone, sentiment predicts very little in time to act on it.
The four-layer engagement measurement framework
Effective measurement combines four data layers, and each one answers a different question. Together they form a complete operational picture.
1. Sentiment data: how store teams feel about the work
Sentiment data tells you what associates think about their role, their manager, and their store. It comes from pulse surveys, stay interviews, and exit interviews. It’s the layer most retailers already measure, but most measure it once a year instead of continuously. Quarterly pulse surveys give you trend data instead of a single point. Stay interviews at tenure milestones surface specific operational issues you can act on, and exit interviews diagnose the patterns that drive turnover.
2. Behavioral data: what store teams actually do
Behavioral data reveals disengagement before sentiment data does. It includes task completion rates, training participation, communication response times, and how often frontline teams post and contribute. An associate who stops completing optional training has often disengaged weeks before they’d admit it on a survey. A team whose response time to HQ has doubled is signaling something the next pulse survey won’t catch for months.
3. Operational data: how engagement becomes performance
Operational data is where engagement becomes commercial. It includes sales per labor hour, conversion rate, customer compliments captured, and store visit scores. Engagement measured on its own is an HR metric. Engagement measured against sales per labor hour, customer satisfaction, and absenteeism by store is an operations metric. Retailers that connect the two turn engagement into a board-level conversation rather than an HR review item.
4. Lifecycle milestone data: when engagement decisions are made
Lifecycle milestone data captures associates at the exact moments engagement decisions get made: day 30 post-onboarding, day 90, six months, after a promotion, and before and after peak periods. Most retail attrition is decided in narrow windows, such as the first six weeks, the first promotion that doesn’t come, or the first peak that breaks them. Measuring at these moments gives you actionable intelligence while action still matters.
Why all four layers matter
Each layer on its own is incomplete. Sentiment without operational data is opinion. Operational data without sentiment is a black box. Behavioral data without lifecycle milestones produces patterns no one can interpret. The four layers only work as a system. Measure one and you get noise. Measure all four and you get a signal you can act on.
How often to measure each layer
Cadence matters as much as the metric, and the right cadence is different for each layer.
- Sentiment data: quarterly pulse surveys, plus stay interviews at every tenure milestone, plus exit interviews on every voluntary departure. An annual survey gives you one data point and leaves the next 364 days blind.
- Behavioral data: continuously, drawn from the platforms store teams already use. It’s the cheapest layer to collect and the easiest to ignore, so don’t ignore it.
- Operational data: weekly or monthly, mapped to engagement by store. A weekly view shows you what’s changing, and a monthly view shows you what’s stable.
- Lifecycle milestone data: at the specific moments named above. The cadence is the milestone, so skip the milestone and the layer disappears.
“The worst thing you can do is get feedback and not do anything with it. That's where the annual survey doesn't serve its purpose. Quarterly is great, because you can track progress, you can see if you're addressing the challenges, and you're learning and acting in real time.”
Steve Worthy,, Founder & CEO of Worthy Retail, on the Frontline Fridays podcast
Connecting engagement measurement to store performance
The framework produces data, and data on its own changes nothing. The bridge from measurement to performance runs through three operational practices.
Tie engagement metrics to store-level outcomes
Pair every engagement metric with a store performance metric. Track sales per labor hour against monthly engagement score. Track customer compliments against quarterly recognition activity. Track absenteeism against pulse survey results. When the two move together, engagement stops being an HR concept and becomes a P&L concept.
Make the data visible to operators, not just analysts
Engagement data that lives inside HR systems never reaches the people who can act on it. The store manager, the district manager, and the regional operations lead all need to see the engagement signal for their stores in the same view as their sales numbers. Platforms like YOOBIC make this practical by consolidating task execution, communications, recognition, and engagement signals into a single mobile platform that store teams already use every day. The store manager sees the engagement signal next to the task list, not in a separate HR report.
Close the loop visibly
Engagement data is only useful if associates can see what changed because of it. When a pulse survey result drives a specific operational change, and that change is credited publicly to the survey, the next survey gets more honest answers. Recognition reinforces the same loop: high-quality recognition has a 0.455 correlation with engagement in joint Gallup and Workhuman research, and well-recognized employees are 45% less likely to have turned over two years later. When the data drives nothing visible, response rates drop and data quality collapses.
Store execution impacts every margin decision
Give frontline teams the tools, visibility, and guidance
to execute consistently across every location.

What good measurement enables in retail operations
Retailers that get measurement right unlock four capabilities that survey-only retailers can’t match.
- Predictive turnover modeling. Lifecycle-based listening can predict turnover with up to 85% accuracy, which makes most attrition preventable rather than reactive.
- Store-level engagement comparison. Continuous measurement shows which stores are improving and which are slipping, in time to investigate the difference. Survey-only measurement misses this entirely.
- Interventions targeted by data. Knowing which layer is breaking, whether sentiment, behavior, operations, or lifecycle, tells you which intervention to deploy. Generic engagement initiatives waste budget, and data-targeted ones move metrics.
- Connection to commercial outcomes. Engagement measured against sales, customer satisfaction, and absenteeism becomes a board-level conversation, not an HR project, and that conversation unlocks the investment engagement work usually struggles to win.
YOOBIC customers run this work in practice. Michaels combined sentiment, behavioral, and operational data on a single platform, branded internally as Mik Check. Engagement climbed from around 30% to between 80 and 90%, task completion improved by 30%, and district managers saved roughly 4,000 hours. Lidl uses continuous operational and behavioral data to track engagement at the store level across its supermarket network, replacing the periodic survey model with an always-on signal.
How to upgrade your engagement measurement this quarter
- Pair one engagement metric with one store performance metric. Sales per labor hour against monthly engagement score is the strongest starting pair.
- Replace your annual survey with quarterly pulse surveys, and move the freed-up budget into behavioral and operational data.
- Add stay interviews at day 30, day 90, and six months for every new hire. The 85% turnover prediction accuracy lives in this layer.
- Move engagement data out of HR-only dashboards and into the platform store managers already use daily.
- Pick one piece of frontline feedback you can act on this month, and publicize the change. Visible loop closure lifts the quality of every future measurement.
Book a demo and find out how
Avoid wasted hours, blind spots
and lost revenue with YOOBIC

Frequently asked questions
How do you measure retail employee engagement?
Modern retail engagement measurement uses four data layers together: sentiment from pulse surveys, stay interviews, and exit interviews; behavior from task completion, training participation, and communication response times; operations from sales per labor hour, customer compliments, and store visit scores; and lifecycle milestones at day 30, day 90, six months, post-promotion, and peak periods. Annual surveys alone miss most of the signal. The combined four-layer approach predicts turnover with up to 85% accuracy.