
TL;DR
At RTS 2026, YOOBIC showed how routing the right store data to the right person — before a decision needs to be made — closes the execution gap that most retail networks treat as unavoidable.
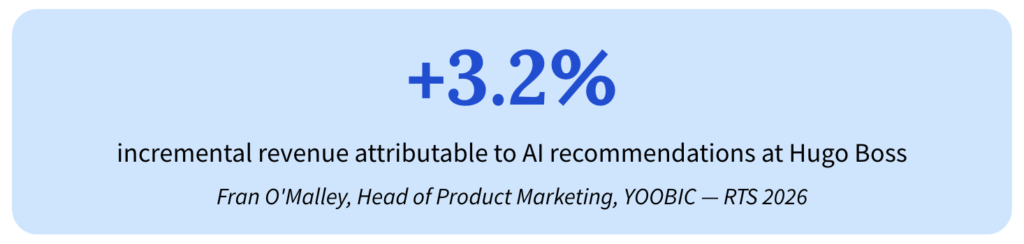
Hugo Boss delivered a 3.2% increase in incremental revenue directly attributable to AI recommendations. The mechanism: an average of 2.4 identifiable commercial opportunities per store, per week, that most networks leave undetected.
Why retail store data alone isn’t enough
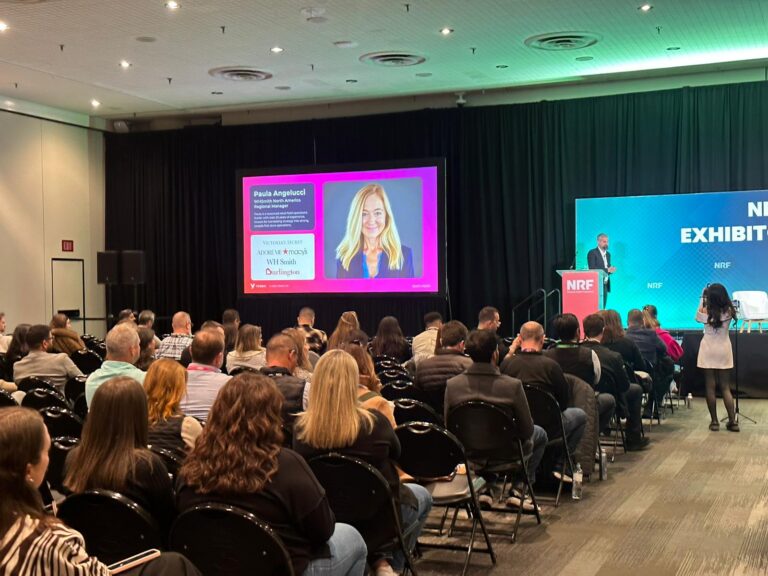
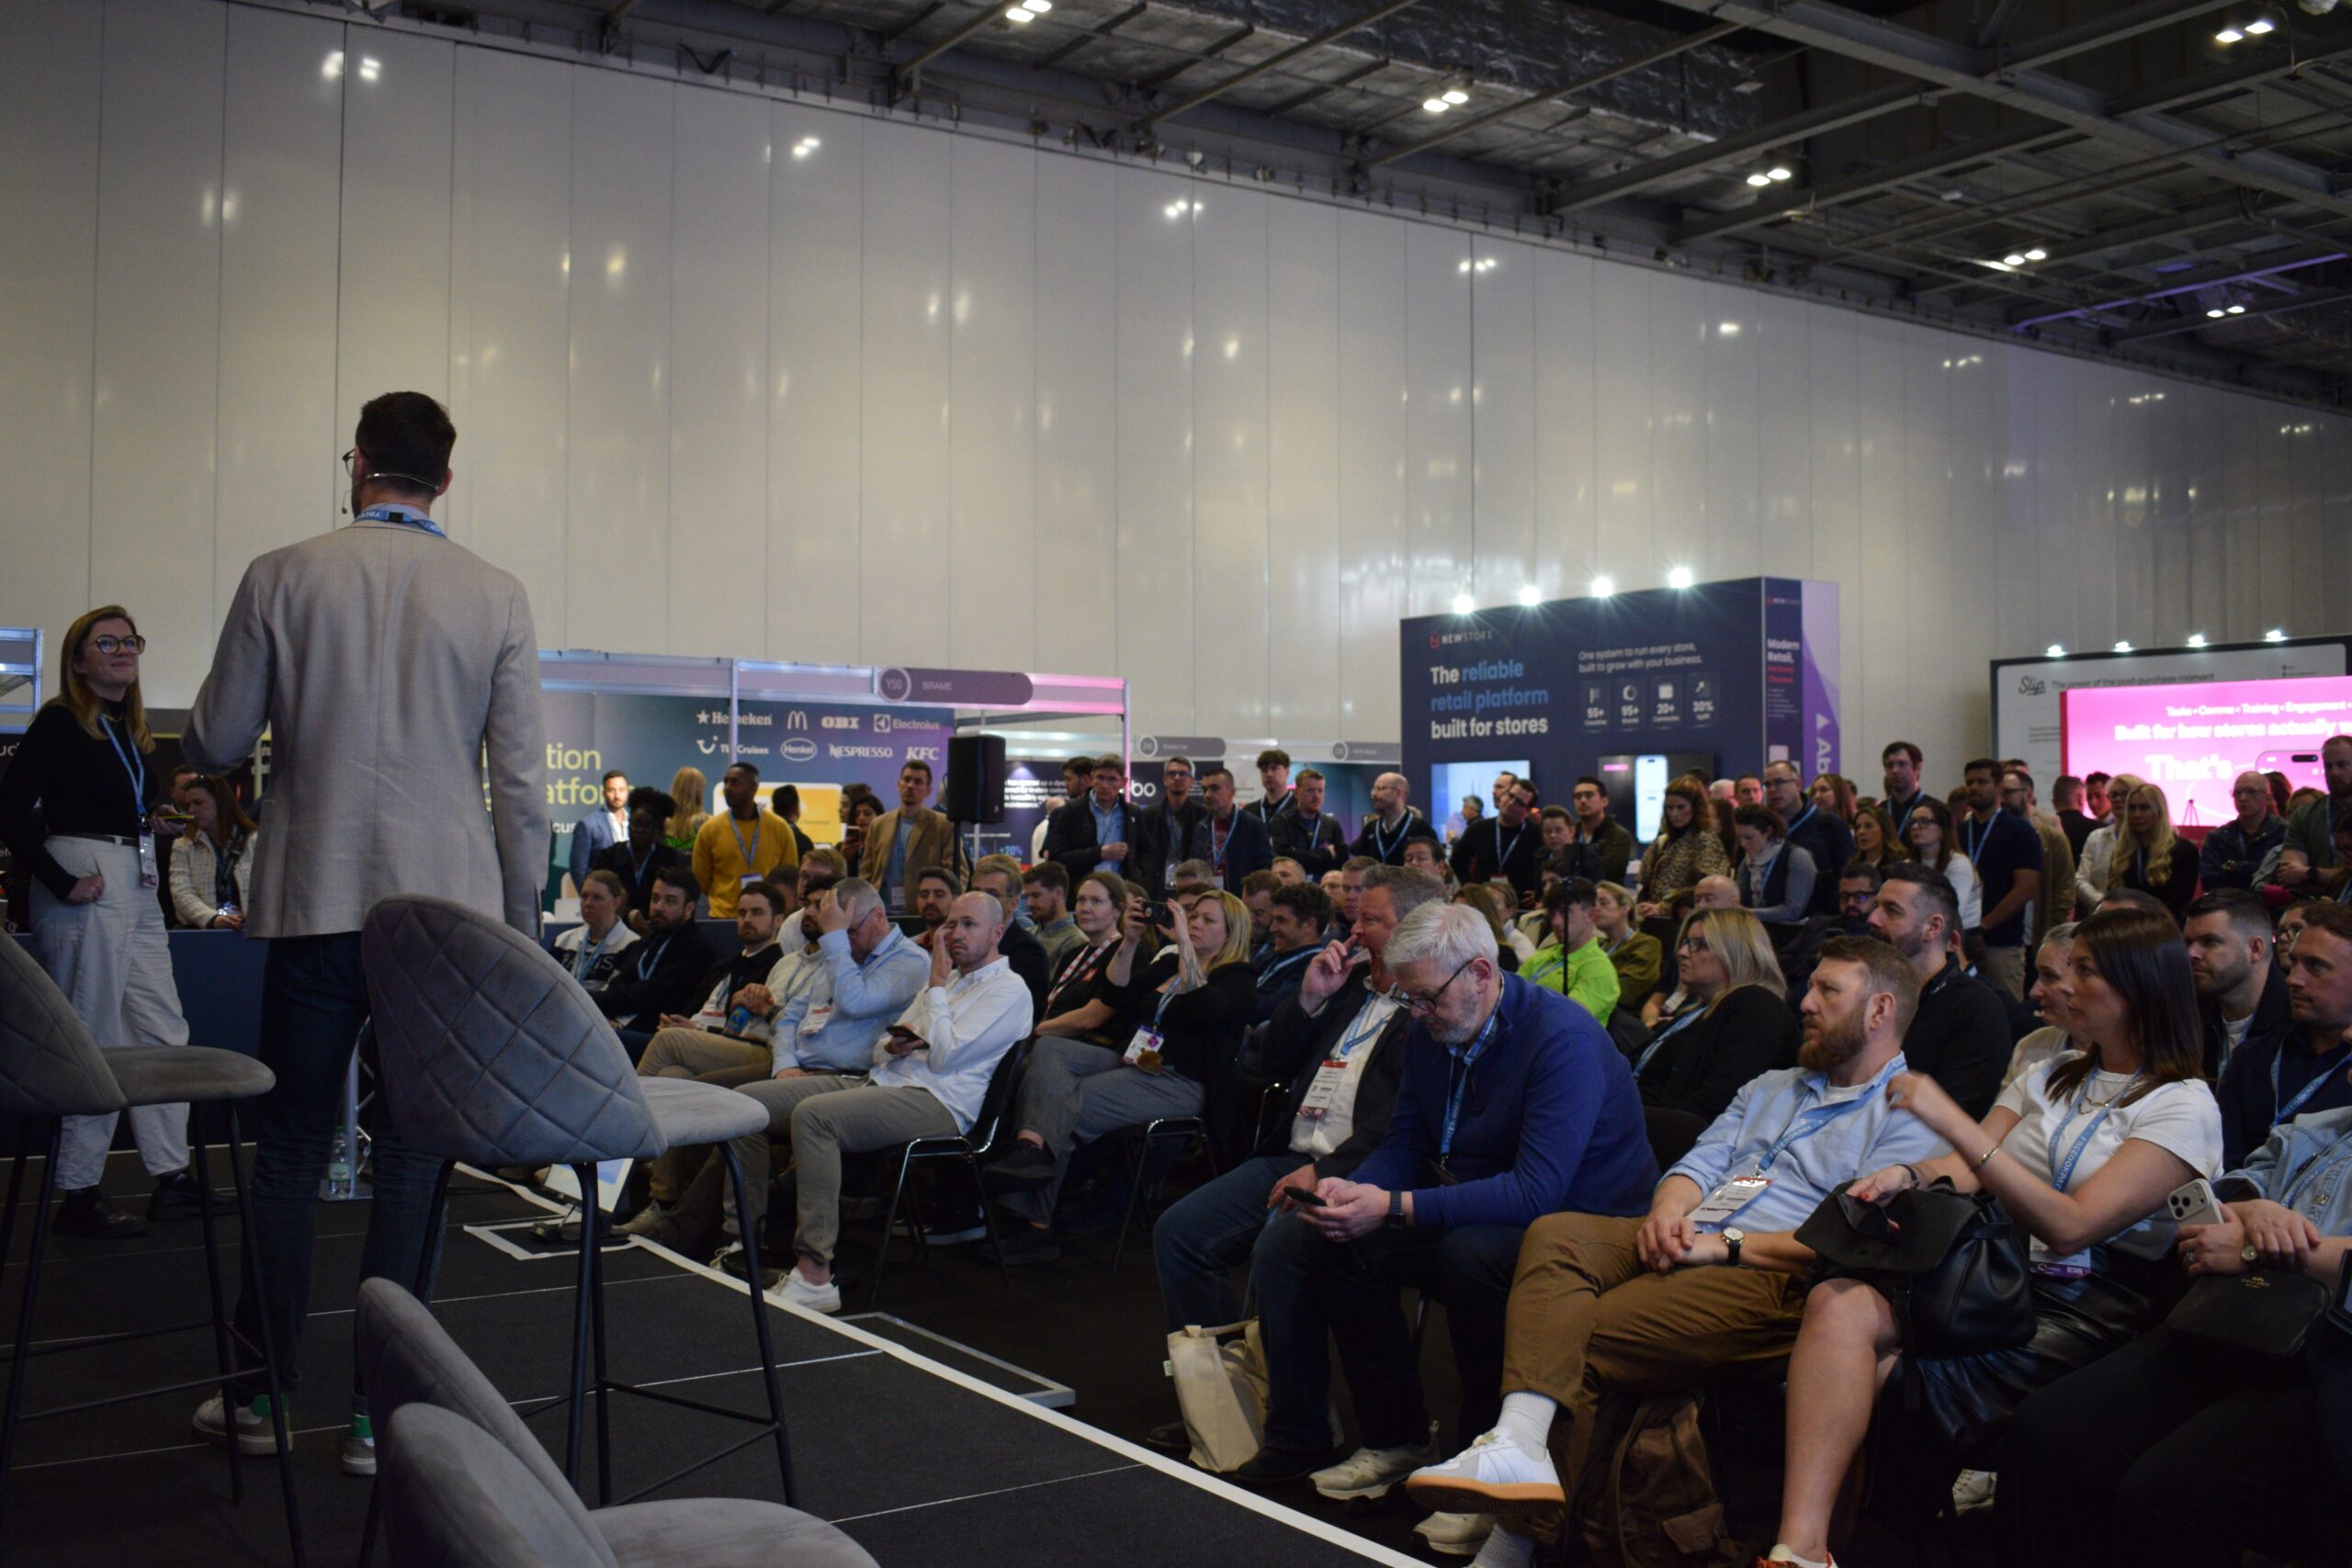
It’s 8:45am. Two people have called in sick, the Wi-Fi is down, and the morning briefing starts in 15 minutes. There is no time for spreadsheets. This is the reality Fran O’Malley, Director of Product Marketing at YOOBIC, used to open the company’s session at the Retail Technology Show 2026.
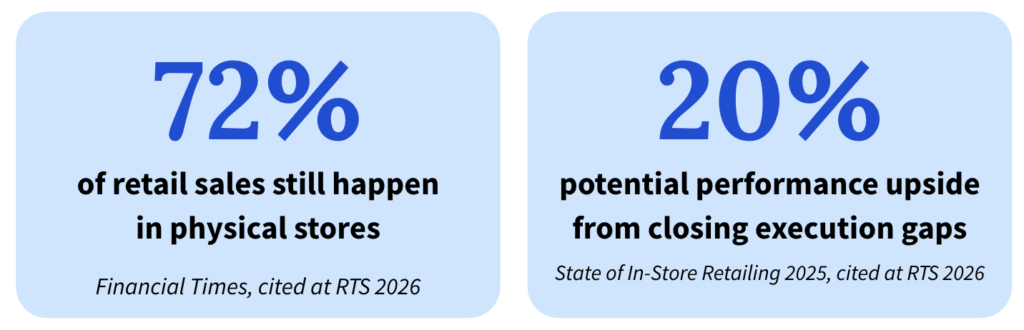
Her point was direct: when 72% of retail sales still happen in physical stores (Financial Times), and when execution gaps — missed product opportunities, non-compliant displays, undetected performance variance — are accumulating across hundreds of locations every day, the cost of getting information to store managers too late, not at all, or in a format that’s difficult to act on is material. Research cited in the session puts the performance upside of closing those gaps at up to 20%.
For a deeper look at how these everyday execution gaps affect retail performance, read our guide to the retail execution gap.
The session covered two AI use cases that address this directly: the Store Manager Copilot and the VM Copilot. What follows is a structured summary of what was demonstrated, what it means for operations leaders, and why the approach produces measurable results.
Why is consistent store performance so hard to achieve across a retail network?
The problem is not a lack of data — it is a lack of relevant, timely data. Each store operates across a unique combination of cluster, footfall, staffing, assortment, and past performance. Without real-time benchmarking against comparable stores, managers default to instinct. The result: performance variation that tracks manager experience rather than store potential.
Most retail networks hold significant data — sales, inventory, workforce, customer feedback. The structural problem is that this data lives in separate systems, arrives at different intervals, and reaches store managers too slowly to influence decisions made at 9am.
As the RTS session slides framed it, each store needs a personalized set of recommendations based on its cluster, past performance, team composition, location, current KPIs, and assortment. Standard dashboards and weekly trade reports cannot deliver that level of individualization at the speed the shop floor requires.
The outcome, observed across YOOBIC’s customer base, is that performance variation between stores correlates more with manager experience than with structural factors. In the absence of clear, trusted data, all managers rely on instinct. The difference is that more experienced managers tend to focus on the right activities, while less experienced managers often spend time on work that doesn’t drive results.
Operationally, this means: retailers cannot close that variation by hiring better managers or running more training. They close it by giving every manager — regardless of experience — access to the same quality of contextualized, benchmarked insight at the same time.
How does YOOBIC’s AI turn store data into action?
YOOBIC’s AI follows three steps: connect all available store data, apply predictive AI to benchmark performance and rank opportunities by impact, then route a specific recommended action to the specific role that can act on it. The output is not a new report. It is a prioritized task, delivered to the right person before the moment of decision.
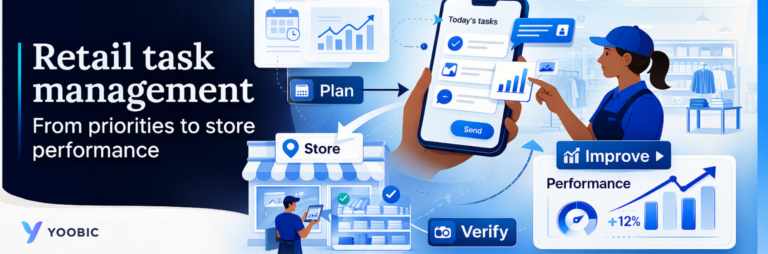
This is the same operational shift explored in our guide to retail task management, where store work moves from scattered communication to structured, trackable execution.
YOOBIC described the architecture as three linked stages: connect your data, make it smart, act on it.
How YOOBIC’s AI processes store data
1. Connect — Unify inputs from point-of-sale, inventory, performance data, footfall , and external signals including weather and local events into a single connected view.
2. Analyze — Benchmark each store against a comparable peer group. Identify anomalies and commercial opportunities ranked by likely revenue impact.
3. Route — Deliver the right action to the right person. Store associates receive task guidance. Store managers get performance snapshots and opportunity alerts. District managers see cross-store rankings. HQ operations get portfolio-level compliance and campaign rollout data.
For more on how managers use mobile workflows to coordinate work on the sales floor, read how store managers use retail task management software.
The routing logic is the critical differentiator. Insight that reaches the wrong person, or the right person too late, does not change behavior. Insight that reaches a store manager before the morning briefing — in the form of one specific action — does.
“What we do not want to do is just fire tons of notifications, flood the store, nothing gets done, they just tick that they've done it, and you're in the same place as you started.”
Bradley Capon, VP Sales, YOOBIC
Operationally, this means: AI that floods store teams with low-priority alerts produces the same outcome as no AI at all. The operational value comes from constraint — surfacing the one or two actions most likely to move the KPI that day, for that specific store.
How did Hugo Boss achieve a 3.2% revenue increase with AI?
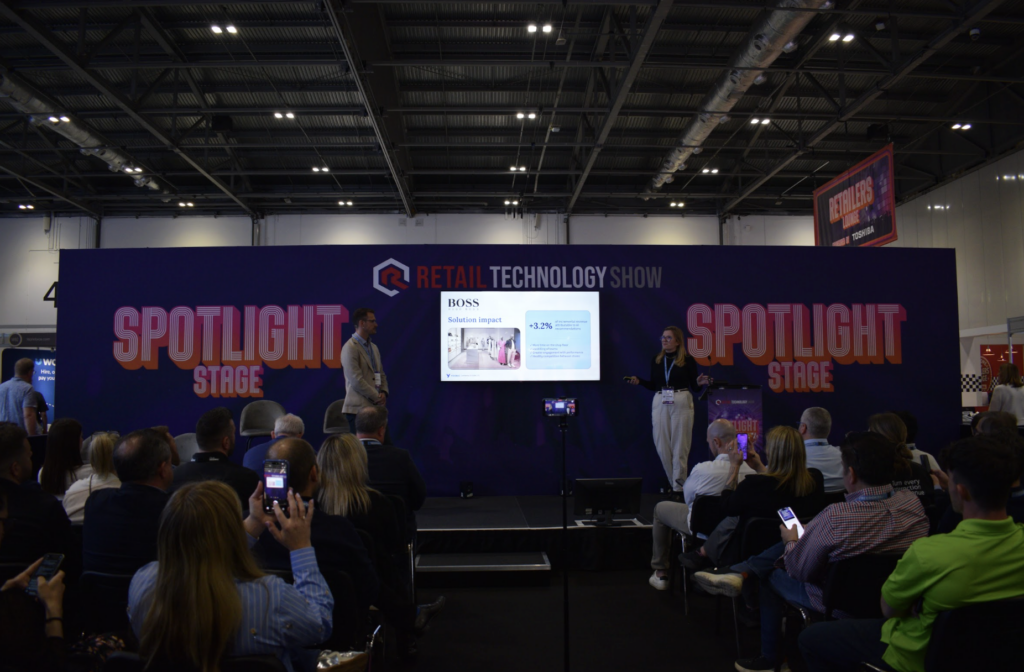
Hugo Boss had access to data, but translating it into clear, daily priorities at the store level remained a challenge. Store managers were often required to interpret multiple signals and decide where to focus, which led to natural variation in performance. As a result, some revenue opportunities went unaddressed. YOOBIC’s Store Manager Copilot was designed to close that gap. The result: 3.2% incremental revenue directly attributable to AI recommendations, delivered through three specific use cases.
O’Malley grounded the session in Hugo Boss before walking through the product. The brand’s store managers had access to data from multiple sources — spreadsheets, emails, operational systems — but extracting actionable priorities from that data was time-intensive and inconsistent. Decisions defaulted to instinct. Performance varied significantly depending on how experienced the individual manager was.
Hugo Boss: what the challenges looked like before AI
Scattered data — managers were overwhelmed with inputs but unable to identify priorities.
Inconsistent performance — results naturally varied depending on individual manager experience.
Missed opportunities — teams knew they were leaving revenue on the table but could not identify where.
Beyond revenue, the Copilot produced three secondary outcomes: store managers spent more time on the shop floor and less time in the back office; the team’s understanding of which KPIs actually drive performance improved measurably; and healthy competition emerged between stores once managers could see precisely how they compared to peers.
Operationally, this means: the 3.2% revenue figure is the measurable output, but the underlying change is structural — Hugo Boss moved from a network where performance depended on manager experience to one where every manager operates from the same quality of data-driven briefing.
Use case 1: Smart briefings — replacing the pre-shift spreadsheet review
The smart briefing is a daily, automated performance summary delivered before the store opens. It surfaces yesterday’s results against target, units per transaction, average basket value benchmarked against comparable stores, predicted traffic for the day, and a specific recommended focus.
In a typical scenario, a store might beat its previous day’s target, with units per transaction above average. But average product value could still lag behind comparable stores — a sign the team is optimizing for volume over value. The recommendation: prioritize higher-value products during predicted high-traffic periods. Instead of interpreting multiple reports, the store manager walks into the morning briefing with a clear, data-backed agenda.
Operationally, this means: a manager who previously spent 30 minutes cross-referencing data before a briefing now has that synthesis waiting for them. At scale, that 30-minute saving per manager per day translates into more time on the shop floor, more coaching, and more consistent execution.
Use case 2: Commercial opportunity identification — closing the gap between stores
To understand why connecting sales and operational data is so important for identifying these gaps, read why retailers need to align sales and operational data.
Every store in a retail network underperforms in at least one product category relative to comparable locations. Most of that variance goes undetected until a monthly trade review — by which point the opportunity has passed.
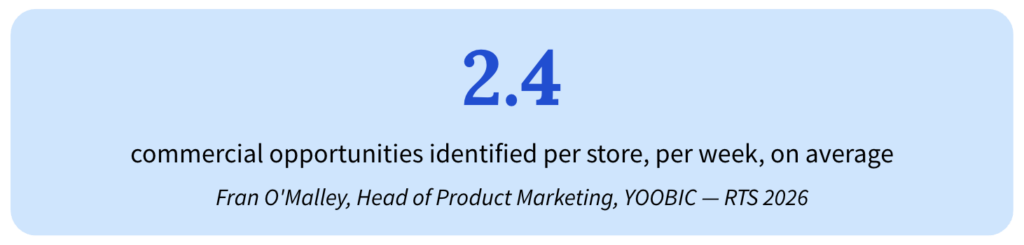
Operationally, this means: an average of 2.4 opportunities per store per week means the revenue gap from undetected opportunities is not marginal — it is structural and recurring.
Use case 3: KPI boosters — simulating performance before committing to action
When a KPI falls below target, a store manager faces two questions: is this gap closable today, and what specifically should I do about it? The KPI booster feature answers both.
A manager simulates the effect of a KPI shift — for example, moving units per transaction up by two points — and sees the projected impact on the day’s sales target. The system then surfaces product bundles that are performing in comparable stores, using only items currently in stock.
As Capon noted, the AI is built around the KPI agreed at project start. If average basket value is the priority, the recommendations reflect that. If volume is the focus, the logic changes. The store manager decides what to act on.
Operationally, this means: KPI simulation removes two forms of friction: managers no longer need to estimate whether a gap is closable, and they no longer need to rely on instinct or head-office guidelines to know which products to push. Both decisions are data-backed and stock-verified.
How does AI reduce the time between issuing brand guidelines and achieving compliance?
VM compliance delays are a process problem, not a people problem. Feedback loops — send guidelines, receive photos, review, return feedback, receive corrections — have historically taken days to weeks. YOOBIC’s VM Copilot breaks the loop by analyzing photos in real time at the point of execution, resolving 50% of feedback before it reaches HQ. This compresses the compliance window without adding headcount.
For a deeper breakdown of how retailers use visual merchandising software to speed up photo validation and improve compliance, read our guide to visual merchandising software.
YOOBIC processes 80 million photos per year across its client base. Until recently, every photo required human review. That volume — which grows with every new campaign and every additional store — represents a review capacity constraint that cannot be solved by hiring alone.

YOOBIC built the VM Copilot by first understanding exactly where review time was being lost. The research process: 50 hours of customer interviews, analysis of tens of thousands of photo comments from VM teams. The finding was precise: 50% of all HQ feedback to stores was about basic brand standards — tags showing, garments not folded correctly, boxes in the wrong position. None of this required VM expertise. All of it was consuming VM team capacity.
The Copilot analyzes each photo across three categories:
How YOOBIC’s VM Copilot analyzes each photo
Each photo is assessed against brand standards to identify execution gaps and opportunities for improvement. Store teams receive clear, actionable guidance on how to improve compliance, styling, and overall display quality.
When a store team submits a photo, the Copilot provides feedback at the moment of execution — before the image reaches the HQ review queue. Store teams receive in-moment corrections. HQ teams receive a prioritized view of the images most in need of their attention, with AI analysis already surfaced.
Operational result for VM teams
Store teams receive same-session feedback — corrections happen before the next customer walks past.
50% of HQ feedback volume is resolved at source, before it enters the review queue.
HQ VM specialists see the highest-priority images first, with AI flags already attached.
The compliance loop compresses from days to hours without adding headcount.
Operationally, this means: recovering 50% of HQ VM review capacity does not just save time — it redirects skilled VM specialists away from basic standards enforcement and toward the work that actually requires their expertise: campaign styling, display innovation, and brand elevation.
What changes operationally when AI is in place?
| Operational area | Without AI | With YOOBIC AI |
| Morning briefing preparation | 30+ minutes reviewing multiple reports and spreadsheets before store opens | Automated briefing ready before the manager arrives — no preparation required |
| Commercial opportunity detection | Visible in monthly trade reviews, if identified at all | 2.4 opportunities surfaced per store per week, benchmarked against comparable stores, in real time |
| Performance benchmarking | Network averages only; no peer-store comparison available at store level | Each store benchmarked against comparable sites by cluster, location, assortment, and past performance |
| VM compliance feedback loop | Days to weeks, dependent on HQ review queue and team capacity | Real-time in-store coaching at point of execution; 50% of feedback resolved before HQ review |
| KPI improvement planning | Dependent on manager experience; instinct-driven product selection | KPI impact simulated before action; bundle suggestions verified against current stock |
| Performance consistency across network | Strongly correlated with individual manager experience level | Data-driven briefings reduce reliance on experience; opportunities identified consistently across all locations |
Key takeaways from RTS 2026
1. The value of AI in stores is determined by routing logic, not algorithm sophistication
Insight that reaches the wrong person, or arrives after the decision has already been made, has no operational value. YOOBIC’s approach prioritizes getting the right action to the right role at the moment it can be acted on. Hugo Boss’s 3.2% revenue uplift is a routing outcome as much as a data science outcome.
2. Every store network contains recurring, identifiable revenue gaps
An average of 2.4 commercial opportunities per store per week — each benchmarked against comparable stores and verified against stock — represents a structural, recurring source of revenue that most networks leave undetected.
3. Manager experience is the variable AI is most directly designed to level
Performance variation across Hugo Boss stores correlated with manager experience, not store potential. AI that gives every manager the same quality of benchmarked, context-specific briefing reduces that dependency. The brand moved from inconsistent, experience-dependent decision-making to consistent, data-driven execution — across its entire network.
4. The VM compliance loop is a capacity problem AI solves structurally
50% of HQ VM review time was being spent on basic brand standards that required no specialist judgment. That is not a people problem — it is a process design problem. Placing AI earlier in the review cycle recovers that capacity permanently, without additional headcount, and redirects it toward work that requires genuine VM expertise.
5. The KPI northstar must be defined before deployment, not during it
YOOBIC builds its AI logic around the KPI agreed at project start. That anchor determines what data is surfaced, what opportunities are flagged, and what actions are recommended. AI without a defined priority surfaces noise.
Conclusion
The signal from YOOBIC’s RTS 2026 session was not about AI capability in the abstract. It was about where operational value lands when AI is deployed with a clear brief.
Hugo Boss’s 3.2% revenue increase did not come from a more sophisticated algorithm. It came from routing the right data to the right person at the right moment — before the morning briefing, at the point of photo submission, in the seconds before a KPI decision is made. Replicated across 2.4 opportunities per store per week, across a network of hundreds of stores, the aggregate is material.
For retail operations leaders, the question is not whether AI belongs in stores. According to Bradley Capon, VP Sales at YOOBIC, it will be in every store within a year. The question is what to prepare. The answer from this session is precise: define the KPI you are trying to move, identify where the data that would move it currently sits, and close the gap between those two things.
“We want to make sure that you're using that data effectively to make sure that you can drive sales.”
Bradley Capon, VP Sales, YOOBIC
Book a demo and find out how
Avoid wasted hours, blind spots
and lost revenue with YOOBIC