

A store manager arrives before opening and heads straight to the back office. The first two hours go to reading headquarters (HQ) emails and printing the day’s task list. Then they chase down who handled yesterday’s price change, and whether anyone finished it.
Not a single customer has been helped yet. That gap between effort and selling is where retail operational efficiency starts, and it’s a gap most reports never show.
You probably check sales and margin every day. The effort behind each sale is much harder to see. The U.S. Bureau of Labor Statistics (BLS) tracks that effort as output per hour worked.
According to BLS productivity data for 2025, published May 28, 2026, that figure grew 2.9 percent in retail trade. Output grew 2.5 percent and hours worked decreased 0.4 percent. In plain terms, stores produced more while using less time.
Time is the scarcest resource in any store. When staffed hours shrink, each one has to earn its place on the sales floor. If you run stores, you already know how fast a lost morning spreads into a wasted day.

This guide explains the term, names the biggest drains, lists the metrics to track, and sets out six steps.
Key takeaways
If you only have a minute, start with these four points.
Efficiency compares what your stores produce with the hours, stock, and money they consume
The biggest drains are task overload, scattered tools, unverified execution, and staff churn
Key performance indicators (KPIs) work best grouped by family and backed by proof instead of self-reports
Saved time only pays off once you redeploy it to the sales floor
What is retail operational efficiency?
Retail operational efficiency is how much useful output a retailer gets from the time, labor, stock, and money it puts in. Output covers sales, completed tasks, served customers, and compliant stores.
Put simply, it’s output divided by input. Sales per labor hour is the everyday example: weekly revenue divided by the staffed hours used to earn it. You can have strong sales and weak efficiency at the same time.
Two neighboring terms often get mixed up with it. Operational excellence is when consistent results become the default in every location. Our retail operational excellence guide covers that goal in depth.
Retail operations is the system itself: the people, processes, and tools that run your stores. For the structure behind that system, read about how retail operations works. Efficiency measures how well that whole system converts effort into results.
Picture two stores that take in the same sales in a week. At the first, the team builds Monday’s promo set correctly and moves on to customers.

At the second, the set goes up wrong on Monday. On Tuesday afternoon, two associates tear it down and rebuild it while shoppers wait at the register. By Sunday, that second location has used 40 more labor hours to reach the same number.
The weekly sales report shows two identical stores. Their efficiency tells a different story, and it shows up in hours long before it reaches the profit and loss statement.
Why does retail operational efficiency matter right now?
Teams keep turning over, and inventory errors remain expensive. Together, those pressures make every wasted hour hurt more than it used to.
A new hire is working their second shift on a Thursday. Markdown instructions went out that morning, but only in an email to the manager. Nobody showed the new hire where the list lives, so the old prices stay up until close.
Shoppers pay full price, and a few of them complain at the register. If you manage a store, you’ve likely lived some version of that shift.
Churn makes consistent execution harder
The Job Openings and Labor Turnover Survey (JOLTS) tracks how often workers leave their jobs. The monthly JOLTS quits data shows a retail trade rate of 2.4% in August 2025. By August 2026, the preliminary figure had climbed to 3.0%, or about three in every 100 workers each month.
That rate counts quits during a single month as a share of employment, seasonally adjusted. It isn’t an annual turnover figure. Still, it means your processes have to work for someone who started this week.
Inventory errors still carry a heavy cost
Stock accuracy adds a second pressure. According to IHL Group’s 2026 inventory distortion study, “Global inventory distortion has improved for five straight years, falling from 10.4% of retail sales in 2021 to 6.2% in 2026. That progress still leaves a $1.7 trillion annual problem.”
That figure covers retailers worldwide. On your floor, it looks like a skipped stock count or a replenishment task nobody picked up.
What drains operational efficiency in retail stores?
Four drains show up in almost every store network: task overload, scattered tools and channels, unverified execution, and lost know-how. Each one costs you hours before it hurts your sales.
An associate is setting an endcap and can’t find the planogram. They ask the manager once before lunch, again mid-afternoon, and a third time near close. Each question pulls the manager off the floor, and the display still looks half-built at 6:00 pm.
Small searches like that add up across every shift and every location.
| Drain | What it looks like on the floor | What it costs you |
|---|---|---|
| Task overload | Dozens of head office tasks land at once, and managers sort them by hand | Manager hours spent sorting instead of coaching |
| Scattered tools and channels | Instructions split across email, group chats, paper, and shared drives | Time lost searching, plus missed or duplicated work |
| Unverified execution | Tasks marked done with no proof they were done right | Rework, failed promotions, and compliance risk |
| Lost know-how | Experienced staff quit, and the steps they knew go with them | Slower onboarding and repeated mistakes |
Unverified execution tends to hide the longest. Read about the retail execution gap to see why plans and store reality drift apart.
Task overload is usually the easiest drain to spot. At Morrisons, head office distributed between 80 and 100 operational tasks to stores every week.
Managers had to interpret each one and cascade it to their teams. The retailer then changed how that work reached stores.
90% reduction
in manager task load after tasks were routed straight to the colleague responsible
Morrisons
If your managers act as a relay between head office and the floor, start there. Prioritizing means subtracting work first.
Which KPIs measure retail operational efficiency?
No single number captures it. You track a small set of KPIs across families and read them together, so one strong figure can’t hide a weak one.
| Family | KPIs | What it tells you |
|---|---|---|
| Operational execution | Task completion rate, compliance rate, time to execution | Whether plans turn into finished work, and how fast |
| Inventory | On-shelf availability, sell-through, inventory turnover | Whether the right stock sits on the shelf and keeps moving |
| Sales and customer | Conversion rate, sales per square foot | How well traffic and space turn into revenue |
| People and workforce | Sales per labor hour, employee turnover, time-to-productivity | How well staffed hours are used, and how soon new hires can work alone |
Verified compliance beats self-reported compliance
A district manager reviews two stores that both report full promo compliance. On the next visit, they walk into the second location and find one endcap still bare.
The report said done. The shelf showed otherwise.
A checkbox records that someone said the work was done. A timestamped photo shows it. Our guide to verifying compliance during store visits explains how to build that proof into every check.
As a starting cadence, review store-level KPIs weekly and network trends monthly. You’ll catch slipping locations early without drowning your managers in reports.
How do you improve retail operational efficiency, step by step?
Start with a baseline, remove work, then verify and train. Finish by redeploying the hours you win back, or the gains quietly disappear.
Six practices that reclaim store hours
1. Measure where store hours go today
Ask each role to log its time for one week. Split the log into selling time, admin, rework, and searching for information. A paper grid or a shared sheet works fine.
Pay close attention to searching and rework, since those hours rarely appear in any report. You need this baseline before you change a single tool.
2. Cut task volume and route every task to its owner
Remove tasks before you add anything new. Target each remaining task by role, store format, and region, so people only see what applies to them. Nobody should have to read an instruction and re-delegate it.
For a practical setup, read about routing tasks by role. Fewer, better-aimed tasks get done faster and more accurately.
3. Replace paper, email, and group chats with one mobile workflow
When one job lives in three places, your team spends time stitching it together. Put the task, the instruction, and the proof in a single mobile workflow.
Michaels replaced paper checklists, store walks, and scattered comms with structured digital tasks on mobile. The result was a 67% decrease in time spent on store admin.
4. Verify execution with photo proof, not checkmarks
Ask for photo evidence on high-value work such as promotions, safety checks, and recalls. Score each photo against a clear standard. Then review exceptions only, so field leaders spend their time where locations fell short.
You don’t need a picture for every task. Save proof for the work that costs you most when it goes wrong.
5. Train in the flow of work
Tie short lessons to the task in front of the associate. A quick guide on building an endcap works best when it opens next to that display task.
That way, a new hire can learn and act in the same moment. You cut rework, and experienced colleagues stop answering the same question every shift.
6. Redeploy the time you save
Decide in advance where reclaimed hours go: peak-hour floor coverage, coaching, or fitting rooms. One store manager moves two freed-up hours a week into Saturday-afternoon floor coverage.
By the next weekend, they watch the fitting-room queue shrink. Without a named destination, saved time fades into the rest of your day.
Where does AI fit in retail operational efficiency?
AI helps most when it narrows your day to a few priorities and routes each one to the right person. Another dashboard rarely helps a busy store manager.
A store manager used to open four reports before 9:00 am. Sales, stock, traffic, and staffing each lived in a different system. Now they start the day with three ranked actions.
They pick the one tied to a slow-selling category and assign it before the doors open. The gain is fewer decisions, made faster, by the person closest to the shelf.
Retail AI budgets are still small
The National Retail Federation (NRF) surveyed 56 AI leaders at US retailers in summer 2025. In NRF’s survey of retail AI leaders, 77% of retailers allocate 5% or less of their technology budget to AI. Supply chain operations, cited by 59%, is an emerging priority.
That means your AI spend has to prove itself on everyday work.
Saved time needs a plan
Boston Consulting Group (BCG) surveyed 11,749 workers for a June 2026 report. In BCG’s 2026 AI at Work survey, 42% of regular frontline users report saving at least a full workday through AI per week. Meanwhile, 66% report limited or no guidance on what to do with that time.
BCG defines frontline here as individual employees without managerial responsibilities, so this isn’t a study of store associates. The lesson still applies to your stores: freed-up time leaks away unless someone directs it.
Comparable-store benchmarking turns data into daily actions
At YOOBIC, we built Store Manager Copilot around that problem. It benchmarks each store against genuinely comparable locations in your own network. Then it turns the gaps into a short, prioritized list of daily actions.
Those actions appear inside the task list your team already uses. AI stays augmented, never autonomous: the manager makes the call.
How do you measure the return on investment of operational efficiency?
Separate cashable savings from capacity. Cashable savings are hours removed from the schedule, while capacity is time you get back and redeploy. Then tie that capacity to a selling or service activity to show its financial return.
An operations lead brings finance a business case built on minutes saved per store. The finance partner rejects it, because minutes on a slide never show up in payroll.
The lead comes back with a new version. It names the Saturday shift those hours now cover and the conversion rate they’ll watch there. That version gets approved, because finance can see where the time went.
Use this four-part framework to build your own case:
Record baseline hours per role for admin, rework, and searching
Count the hours reclaimed after each change
Name where those hours went, by shift and activity
Track what moved, such as conversion, task completion, and turnover
PureGym shows what happens when reclaimed time has a clear destination.
26,000+ hours
saved annually and reinvested into member-facing activity
PureGym
Your finance team will ask where the hours went. Have that answer ready before the meeting starts.
Where is retail operational efficiency heading?
The category is moving toward fewer, clearer actions, verified work, and connected tools. Three shifts stand out.
A regional manager used to follow a fixed visit rota, the same route every month. Now they plan Monday’s visits from the stores that slipped last week. Locations that held steady get a call instead of a drive, and the visits follow need.
From dashboards to prioritized actions
Store managers already have plenty of data. The bottleneck is interpretation: working out which gap matters today and what to do about it. Expect your tools to deliver a short, ranked list instead of another report.
From self-reported to verified execution
Photo evidence and exception review are becoming the default audit trail. You’ll spend less effort asking whether work happened and more on why it didn’t.
From separate tools to one connected workflow
Tasks, messages, and lessons will travel together. An instruction arrives with the training needed to carry it out, so your associates never hunt for context.
The bottom line on retail operational efficiency
Return to that store manager in the back office. Picture the same morning with a few routed, verified tasks waiting on their phone. Those first two hours now go to coaching the team and helping customers.
The three moves are simple: subtract work, verify what matters, and redeploy the hours you win back. You can start the first one this week with a time log.
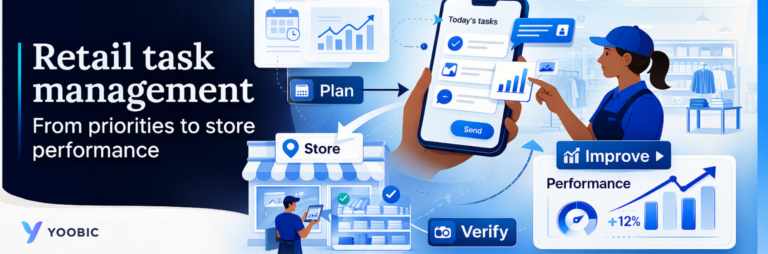
YOOBIC brings tasks, communications, and learning together in one platform built for frontline teams. Our task management for store teams puts priorities, instructions, and photo proof in one mobile workspace. Communications keeps every location aligned, and learning delivers short lessons right where the work happens.
We also fit into the systems you already run, with 200+ integrations. See how that morning could look across your network. Book a demo.
Book a demo and find out how
Avoid wasted hours, blind spots
and lost revenue with YOOBIC

Frequently asked questions
How do you calculate operational efficiency in retail?
Divide output by input, most often as sales per labor hour. Say, as a hypothetical example, a store takes $12,000 in a week across 400 labor hours.