

ROI figures fail because nothing was compared. A defensible number needs a control group designed before rollout, fully loaded costs including wage replacement, and one operational signal rather than four. Time to proficiency, 90-day retention, and error rates move soonest. Completion rates predict almost nothing.
DEFINITION:
Training ROI
Training ROI is the net financial return on a training program, calculated as monetary benefits minus training costs, divided by training costs, then multiplied by 100. A positive percentage means the program returned more than it cost to run.
The arithmetic is not the difficult part. Training ROI figures collapse on their two inputs. One is a benefit that was never isolated from everything else happening in store. The other is a cost that only counted the invoice. This guide covers both, starting with the measure most teams reach for first.
Why completion rates tell you nothing
Ask a retail L&D team whether their training is working, and the answer is usually a completion rate. 94% of associates finished the course. That tells you the course was finished. But it tells you nothing about the shop floor.
The evidence on this is unambiguous. A landmark meta-analysis by Alliger and colleagues tested how well learner reactions predict anything at all. Whether trainees enjoyed a course correlated with actual behavior change on the job at 0.07. Even perceived usefulness only reached 0.18, which is barely better.
0.07 correlation
How much trainees enjoy a course correlates with their behavior change on the job at 0.07. That figure is statistically indistinguishable from zero.
Alliger et al., meta-analysis of training criteria
So a course can be popular, completed, and well reviewed while changing nothing on the floor. High satisfaction often signals low cognitive friction. Meanwhile training that is easy and entertaining scores well and teaches little.
What most teams measure instead
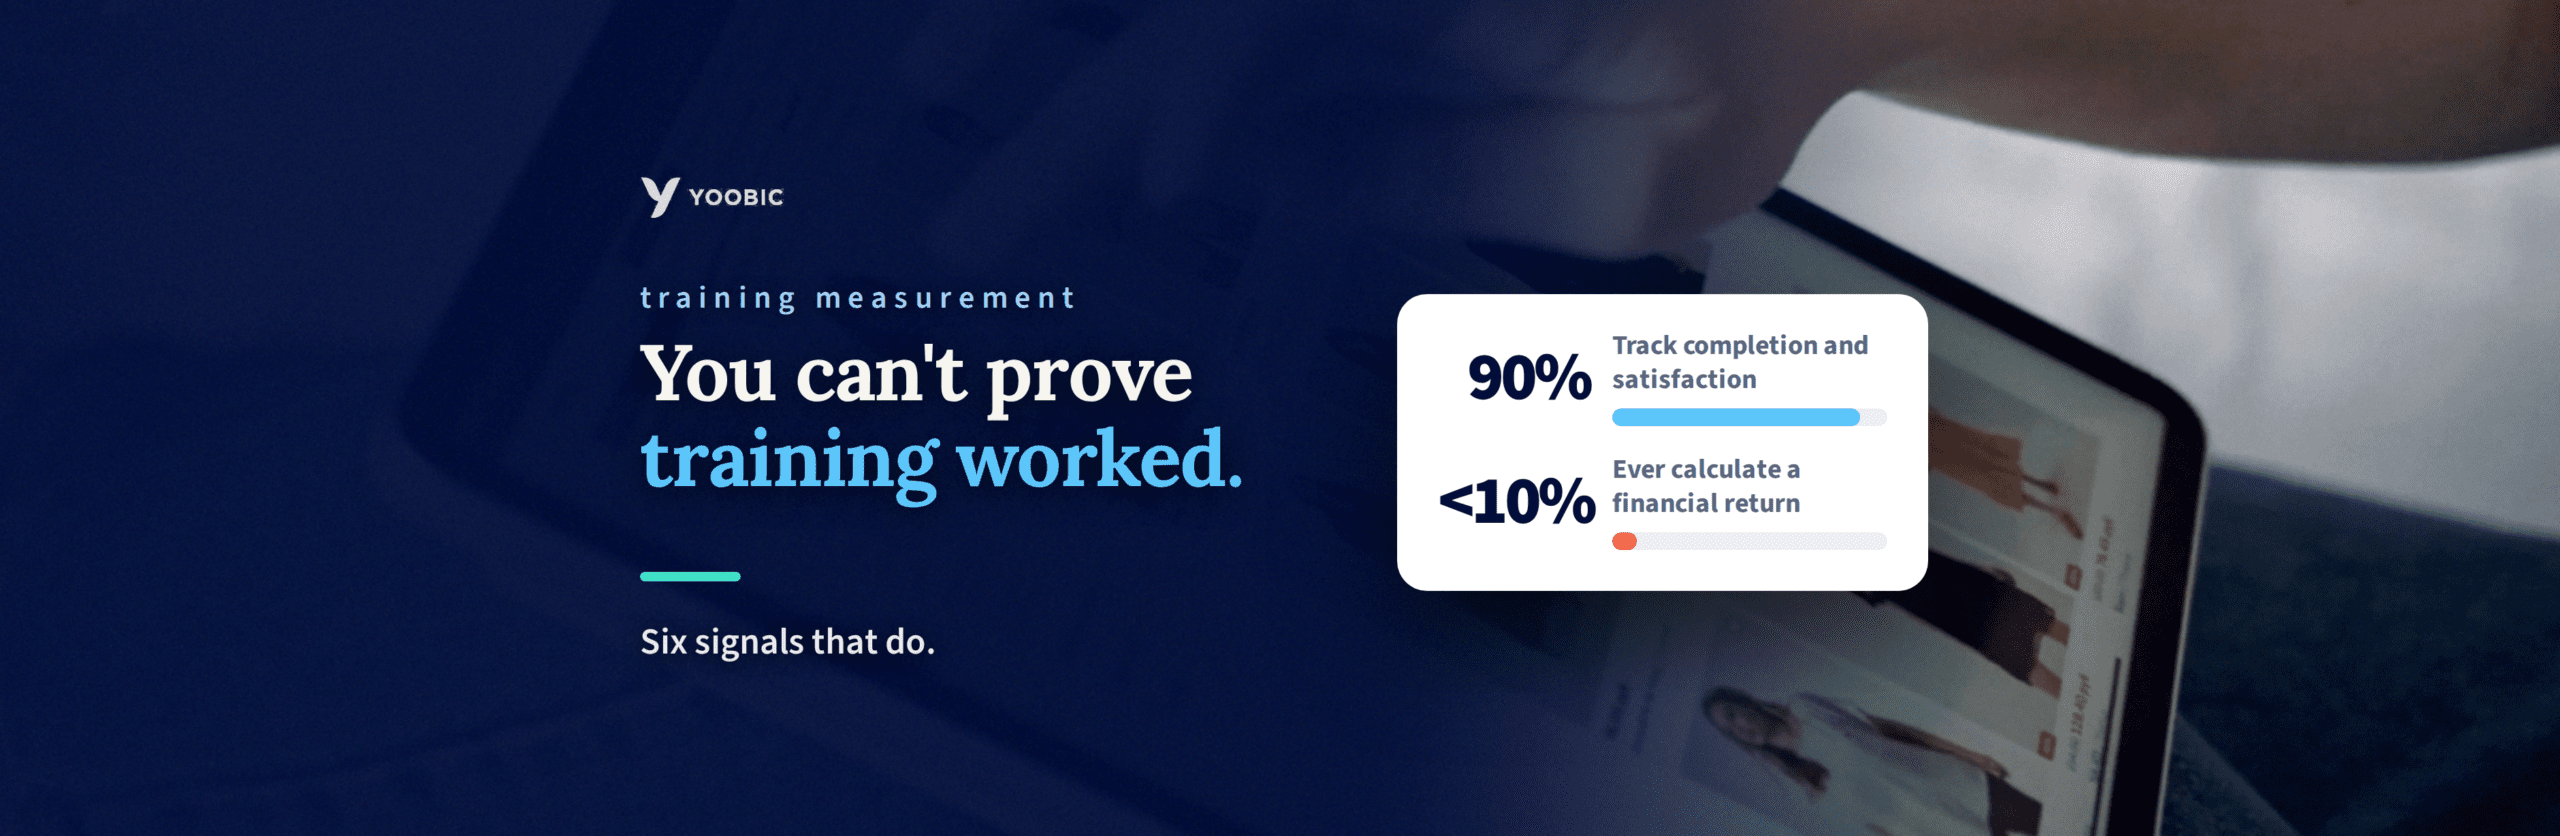
Yet completion and satisfaction are still what almost everyone measures. Around 90% of organizations track them. Under 10% ever get to a financial return. Budget follows the same shape, with roughly 70% of training evaluation spend going to the first two levels. That leaves less than a third to cover the observation, data integration, and isolation work that higher-level evaluation actually requires.
Underneath this sits a capability gap too. Only 29% of L&D leaders say they feel confident demonstrating a financial return to their executive team. Yet that is not a motivation problem. Isolating a training effect needs statistics, data engineering, and financial modeling, and most learning teams were hired to design instruction.
What measuring the skill looks like
The retailers who get past this measure whether the skill shows up in front of a customer, not whether the module closed. UNTUCKit built its clienteling certification so associates can fail it. A certificate that everyone passes measures attendance rather than capability.
“It is not just like, "Oh, check the box and you're done." You have to prove that you've built the skill.”
Sandra Scibelli, Head of US Retail, UNTUCKit
Sources: Alliger et al., meta-analysis of training criteria. ATD State of the Industry. ROI Institute.
Training evaluation methods: where Kirkpatrick and Phillips fit
Most training evaluation still runs on two frameworks, so it is worth knowing where they stop.
Donald Kirkpatrick’s model has four levels in total. Reaction, whether learners liked it. Learning, whether they acquired the knowledge. Behavior, whether they applied it on the job. Results, whether business KPIs moved.
Then Jack Phillips added a fifth. Return on training investment, where the business result is converted into money and set against the fully loaded cost of the program.
So the models are not the problem. Adoption is.
| Level | What it measures | Organizations doing it |
| 1. Reaction | Learner satisfaction | 90 to 95% |
| 2. Learning | Knowledge acquired | 80 to 90% |
| 3. Behavior | Applied on the job | 30 to 35% |
| 4. Results | Operational KPIs | 8 to 28% |
| 5. ROI | Net financial return | 4 to 10% |
INSIGHT
The cliff sits between levels two and three. Almost everyone measures what happened inside the course. Barely a third check whether anything changed outside it.
Which training metrics actually predict performance
Most L&D dashboards are full of numbers that are easy to collect and tell you almost nothing. The useful training metrics are harder to gather and sit in operational systems rather than the LMS.
The distinction is whether the metric measures something that happened inside the course, or something that changed outside it.
| What most teams track | What actually correlates |
|---|---|
| Course completion rate | Time to proficiency |
| Satisfaction score | 90-day retention |
| Hours logged | Error and shrink rates |
| Quiz pass rate | Observed behavior on the floor |
| Logins per week | Conversion, measured against a control |
The column on the left is not useless. It tells you whether the training was delivered and whether people could stand it. It just cannot tell you whether anything changed, which is the question being asked.
INSIGHT
Every metric on the right already exists somewhere in the business. None of them sit in the learning platform.
The right-hand column is the six signals in this guide, in the order they are worth tackling.
Why measuring training effectiveness is harder in retail
Three things make training effectiveness harder in retail than in the generic corporate case, and they compound.
Investment. First, retail spends roughly $400 to $800 per employee per year on training. By comparison, professional services spend $1,300 to $2,300. Formal learning runs 6 to 10 hours a year in retail against 16 to 20 elsewhere.
Margin. Then there is margin pressure. Supermarkets operate on net margins of 1.5% to 2%. At 2%, every dollar of training spend requires $50 of incremental revenue to break even. In practice, a store spending $10,000 a year needs $500,000 in additional sales simply to stand still.
Turnover. Frontline turnover runs 60% to 75% annually. Meanwhile a new associate takes six to eight weeks to reach full productivity. The payback window is short, and it resets constantly.
$50 of revenue per $1 spent
At a 2% net margin, every dollar of training spend needs $50 of incremental revenue to break even.
Source: Retail net margin benchmarks.
Sources: ATD State of the Industry. Retail net margin benchmarks. Retail workforce benchmarks 2024 to 2026.
1. Decide what you’re comparing against
This is not a metric. Instead, it is the thing that makes every other metric mean something, and it has a deadline.
Every reliable read on training is a comparison. That means trained stores against untrained ones. Certified associates against uncertified. This quarter against a projected baseline.
If that comparison is not designed before rollout, it does not exist afterwards. After all, you cannot retrofit a control group onto something that already happened.
INSIGHT
Most programs lose the ability to prove anything in week one, long before anyone asks about results.
2. Time to proficiency
Time to proficiency is the fastest signal available, and also the most underused.
A new retail associate typically takes six to eight weeks to reach full productivity. That window is measurable, it is already tracked in most workforce systems, and it moves quickly when training improves.
It is also the signal least contaminated by outside factors. After all, seasonal demand does not change how long somebody takes to learn the till.
So if training is working, this number falls. If it is not, no amount of course completion will hide that.
There is a second reason it matters. Every week of ramp-up is a week of full wages against partial output, so shortening it converts directly into recovered labor cost.
3. 90-day retention
Frontline turnover runs 60% to 75% a year, and replacing an associate costs roughly 30% to 50% of their annual salary. So anything that keeps people past their first 90 days moves a number finance already tracks and already believes.
Turnover also changes the entire economics of training in a way most models miss.
DEFINITION:
Cost per stable FTE year
Cost per stable full-time-equivalent year takes the onboarding cost of a role and divides it by one minus the turnover rate. So it shows what each retained seat really costs once churn is priced in, rather than what the training cost to deliver.
Take a $2,500 onboarding cost. At 30% turnover that works out at about $3,500 per stable seat. Push turnover to 50% and it reaches $5,000. At 70% it becomes over $8,000.
The training did not get more expensive. The churn did. Which means better early retention improves the return twice over, once through the people kept and once through the hires avoided.
The full cost of that churn is worth understanding separately. We have broken it down in our guide to reducing employee turnover in retail.
Source: Retail workforce benchmarks 2024 to 2026. Cost per stable FTE year model.
4. Error and shrink rates
This is the signal most retailers already have, yet rarely connect to training.
Nationally, retail shrink runs at 1.68% of sales. Administrative and paperwork errors account for 12% to 21% of that. That covers miscounts, scanning mistakes, bad receiving logs, and unrecorded markdowns. All of it trainable, and all of it already being counted somewhere.
There is a second version of the same signal that rarely gets measured at all. Frontline associates lose 15% to 25% of working time to operational friction. Searching for information, chasing clarification, and redoing work that was wrong first time.
15% to 25% of working time
Frontline associates lose this much of their working time to operational friction. That includes searching for information and redoing work that was wrong first time.
Source: Deskless workforce research.
Improving frontline productivity is one of the clearest returns available here, because the time recovered is time already being paid for.
Source: National Retail Federation, National Retail Security Survey. Deskless workforce research.
5. Conversion, and why it needs a control group
Conversion is the signal everyone wants, and for good reason. It is also the one most often claimed without evidence.
However, a store is never running one experiment at a time. When conversion rises after training, so did the season, the promotion, the new till software, and possibly the store manager. So any of those could be the cause. Training is just the one you happened to be watching.
So the only way to read conversion is to have something to compare it against.
The simplest version is to leave some stores out. Train half the estate, match the other half on baseline performance and size, then compare how each group moved. Whatever the trained group did that the untrained group did not is the training.
If withholding training is not acceptable, stagger it instead. Roll out to one region, then the next a month later. The regions still waiting are your comparison group until their turn comes.
That is genuinely it. Everything else is a workaround for not having done one of those two.
The most common workaround is asking people to estimate. What share of this improvement came from training, and how confident are you in that? Then you multiply the two together. $50,000 in gain, 40% attributed, 80% confidence, gives $16,000.
If conversion is the number your business case rests on, it needs a real comparison group.
6. Knowing when the ROI number isn’t worth chasing
This is the one nobody expects, and it applies to most programs.
Because a full financial return calculation is expensive to produce properly, it earns its place rarely. It needs fully loaded costs, and those are larger than most people assume.
Meanwhile the direct costs understate the total. Licenses, materials, and trainer fees are only 30% to 40% of frontline onboarding cost. The indirect costs make up the rest: wage replacement, backfill overtime, diverted manager time, and lost output during ramp-up.
30% to 40% of onboarding cost
Direct costs such as licenses, materials, and trainer fees account for only this share of frontline onboarding cost. Wage replacement, backfill overtime, diverted manager time, and lost output during ramp-up make up the rest.
Source: Frontline onboarding cost benchmarks.
Leave those out and finance will find them, and the whole number collapses.
So reserve that exercise for the top 5% to 10% of programs by cost and executive visibility. Robert Brinkerhoff argues the isolation goal is wrong in principle anyway. Training never operates alone. It works alongside manager coaching, incentives, tools, and culture. Claiming sole credit for a result that required all four is how L&D loses the room.
For everything else, the first five signals are enough. They move sooner, cost less to track, and are considerably harder to argue with.
Source: Frontline onboarding cost benchmarks.
The test to apply to anyone else’s numbers
This applies to any training case study, including the ones this industry produces. Ask what was compared to what.
Some retailers do isolate. One apparel retailer certified some stores on a selling program and left others uncertified. Afterwards, 48% of the certified stores had improved conversion. Because the uncertified stores were trading through the same season, that difference is attributable. It is a real finding.
Most, however, do not. A 22% conversion lift, measured across every store before and after a rollout, has nothing left to compare against. After all, the season changed too. So did the promotions and the product mix. That number might be training, or it might be a good year, and there is no way to tell which.
Neither retailer is lying here. But only one of them has evidence.
What this comes down to
In the end, knowing whether store training works is mostly a question you answer before you start.
So decide what you are comparing. Fully load the costs, including the ones that do not appear on an invoice. Then pick one operational signal rather than four. And be honest about when a financial return is not worth the work of calculating.
Do that, and the number defends itself.
Going deeper
Each of these signals has a fuller treatment elsewhere. Start here if you want to go deeper on one before building your case.
- How to reduce employee turnover in retail, for sizing the retention pool properly
- The retail training guide, for building the program itself
- Microlearning examples, for shortening time to proficiency
Read the full transcript
6 Ways to know if your store training is working
(00:00) What does a completion rate actually tell you?
Somewhere in the next budget cycle, someone in finance is going to ask whether your training is working. It is a reasonable question. For most retailers, it does not have a good answer.
What usually gets offered is a completion rate. 94% of associates finished the course. It sounds like an answer, but it’s not one, because it only tells you the course was finished. Nothing in it touches the shop floor.
(00:24) How well do learner reactions predict behaviour change?
And the evidence here is worse than most people expect. A meta-analysis by Alliger and colleagues tested how well learner reactions predict behaviour change on the job. The correlation came out at 0.07. Statistically, that is indistinguishable from nothing. Even whether trainees found the course useful only reached 0.18.
(00:50) Why do so few organisations measure training ROI?
So the two things almost every retailer measures are the two with the least predictive power. Around 90% track completion and satisfaction. Under 10% ever reach a financial return.
That gap is not laziness. Measuring what happens inside a course is easy because the platform does it for you. Measuring what happens afterwards on a shop floor in a store 400 miles away is a different kind of work. It needs comparison groups, operational data, and a decision made before anything is rolled out. Which is what this walkthrough covers.
(01:11) What should you compare training results against?
Starting with number one, check what you compared it to.
This is not a metric. It is the thing that makes every other metric mean something, and it has a deadline. Every reliable read on training is a comparison. Trained stores against untrained ones. Certified associates against uncertified. This quarter against a projected baseline.
If that comparison is not designed before rollout, it does not exist afterwards. You cannot retrofit a control group onto something that already happened. Most programmes lose the ability to prove anything in week one, long before anyone asks about results.
(01:47) How long does a retail associate take to reach full productivity?
Two, time to proficiency. This is the fastest signal available and the most underused. A new retail associate typically takes six to eight weeks to reach full productivity.
That window is measurable. It is already tracked in most workforce systems, and it moves quickly when training improves. It is also the signal least contaminated by outside factors. Seasonal demand does not change how long somebody takes to learn the till.
If training is working, this number falls. If it is not, no amount of course completion will hide that. There is a second reason it matters. Every week of ramp up is a week of full wages against partial output. So shortening it converts directly into recovered labour cost.
(02:28) How does turnover change the cost of training?
Three, 90-day retention. Frontline turnover runs 60 to 75 percent a year. Replacing an associate costs roughly 30 to 50 percent of their annual salary. So anything that keeps people past their first 90 days moves a number finance already tracks and already believes.
Turnover also changes the entire economics of training in a way most models miss. Cost per stable full-time equivalent year takes the onboarding cost and divides it by one minus the turnover rate.
Take a $2,500 onboarding cost. At 30 percent turnover, that is about $3,500 per stable seat. At 70 percent, it becomes over $8,000. The training did not get more expensive. The churn did. Which means better early retention improves the return twice over. Once through the people kept and once through the hires avoided.
(03:18) How is retail shrink connected to training?
Four, error and shrink. This is the signal most retailers already have and rarely connect to training.
National retail shrink runs at 1.68 percent of sales. Administrative and paperwork errors account for 12 to 21 percent of that. Miscounts, scanning mistakes, bad receiving logs, unrecorded markdowns, all of it trainable, and all of it already being counted somewhere.
There is a second version of the same signal that rarely gets measured at all. Frontline associates lose 15 to 25 percent of working time to operational friction. Searching for information, chasing clarification, and redoing work that was wrong first time. That is a training problem wearing a productivity label.
(03:58) Why does measuring conversion need a control group?
Five, conversion and why it needs a control. Conversion is the signal everyone wants. It is also the one most often claimed without evidence.
The problem is that a store is never running one experiment at a time. When conversion rises after training, so did the season, the promotion, the new till software, and possibly the store manager. Any of those could be the cause. Training is just the one you happen to be watching, so the only way to read conversion is to have something to compare it against.
The simplest version is to leave some stores out. Train half the estate, match the other half on baseline performance and size, then compare how each group moved. Whatever the trained group did that the untrained group did not is the training.
If withholding training is not acceptable, stagger it instead. Roll out to one region, then the next a month later. The regions still waiting are your comparison group until their turn comes.
That is genuinely it. Everything else is a workaround for not having done one of those two. The most common workaround is asking people to estimate what share of this improvement came from training and how confident are you in that, then multiplying the two together. 50,000 in gain, 40 percent attributed, 80 percent confidence, gives 16,000.
It looks like arithmetic. It is two guesses multiplied together. The decimal point does not make it a measurement. If conversion is the number your business case rests on, it needs a real comparison group, not an estimate of one.
(05:22) When is a training ROI calculation not worth doing?
Six, knowing when the number is not worth chasing. This is the one nobody expects, and it applies to most programmes.
A full financial return calculation is expensive to produce properly. It needs fully loaded costs, and those are larger than most people assume. Licences and materials are only 30 to 40 percent of frontline onboarding costs. The rest is wage replacement, backfill overtime, diverted manager time, and lost output during ramp-up. Leave those out and finance will find them, and the whole number collapses.
So reserve that exercise for the top 5 or 10 percent of programmes by cost and visibility. Robert Brinkerhoff argues the isolation goal is wrong in principle anyway. Training never operates alone. It works alongside manager coaching, incentives, tools, and culture.
For everything else, the first five signals are enough. They move sooner, cost less to track, and are considerably harder to argue with.
(06:17) How do you tell a real training result from a coincidence?
One last thing, which is a test rather than a signal. It applies to any training case study, including the ones this industry produces. Ask what was compared to what.
Some do isolate. One apparel retailer certified some stores on a selling programme and left others uncertified. Afterwards, 48 percent of the certified stores had improved conversion. Because the uncertified stores were trading through the same season, that difference is attributable. It is a real finding.
Most case studies do not do this. A 22 percent conversion lift, measured across every store before and after a rollout, has nothing left to compare against. The season changed too. So did the promotions and the product mix. That number might be training, or it might be a good year, and there is no way to tell which.
Neither retailer is lying. But only one of them has evidence. Which brings it back to the first signal. Knowing whether store training works is mostly a question you answer before you start.
Start retailing smarter

Frequently asked questions
What does training ROI mean?
Training ROI means the net financial return on a training program, calculated as monetary benefits minus training costs, divided by training costs, then multiplied by 100. A positive percentage means the program returned more than it cost to run. In retail, the figure only holds up when the benefit has been isolated against a comparison group, such as trained stores measured against untrained ones, because a before-and-after reading cannot separate training from season, promotions, or a change of store manager.

