

Retail has spent a decade buying visibility. Dashboards, BI stacks, audit programs and reporting tools now tell store teams more than anyone can reasonably read. A retailer can know exactly which stores are underperforming in a category. Yet getting 400 managers to do something about it this week is a different problem.
AI copilots exist to close that gap. Most descriptions of them stop at “surfaces insights,” which explains nothing. So here is what actually happens between a number moving and someone acting on the shop floor.
DEFINITION:
AI copilot
A retail AI copilot reads a store’s operational and performance data. It decides which performance gaps are worth acting on, then turns those into specific actions for store teams. A dashboard produces a chart. A copilot interprets the data and produces a recommendation with an assigned action behind it.
Managers are not short of data. They are short of hours
The constraint is time, rather than information. McKinsey research on frontline managers found they spend 30% to 60% of their working hours on administrative work and meetings. Another 10% to 50% goes on non-managerial coverage, such as working a register or filling shelves. That leaves 10% to 30% for supervising the floor. Dedicated coaching often compresses to as little as ten minutes a day.
By contrast, high-performing retailers restructure the role. Their managers spend 60% to 70% of their hours on the floor. McKinsey associates that shift with a 19% to 25% cut in labor hours and roughly 10% more sales.
10 minutes a day
Dedicated coaching time for frontline managers can compress to as little as ten minutes, against a best-practice benchmark of 60 to 70 percent of hours spent on the floor.
McKinsey and Company.
Meanwhile, the data usually exists. Databricks and Forrester estimate that 60% to 73% of enterprise operational data is never used for frontline decisions. Adding another dashboard does not fix this, because interpreting the data is the expensive part. A copilot earns its place only if it does that interpreting for the manager, rather than adding more to read. We looked at how that overload builds up in the retail execution gap.
Step one: reading the store
Everything downstream depends on what the system can see, so start there. Store Manager Copilot reads two layers of data. First, external performance signals: sales, stock and foot traffic. Second, YOOBIC’s own execution record: tasks, photos, missions, audits, learning completions and communication read receipts.
While that second half sounds minor, it changes what the system can explain. Sales data tells you a category is down. Execution data tells you whether the promotional setup was ever completed, and whether the team saw the message about it. Therefore systems reading only transactional feeds can identify a gap, but not the operational reason behind it.
Step two: deciding what actually matters
This is where copilots separate from analytics, and where most vendor descriptions go quiet.
The oldest method is comparing each store to the chain average. It is also the weakest, because retail fleets are structurally uneven. A high-volume flagship working hard under severe space constraints can look like a problem store. A low-volume site in an affluent catchment can look like a star. Consequently the average flattens the thing you are trying to measure.
Comparing a store against its own forecast is better. It catches sudden disruption, such as a broken display or a register outage. It still misses chronic underperformance, because a store running below potential for two years matches its own history perfectly.
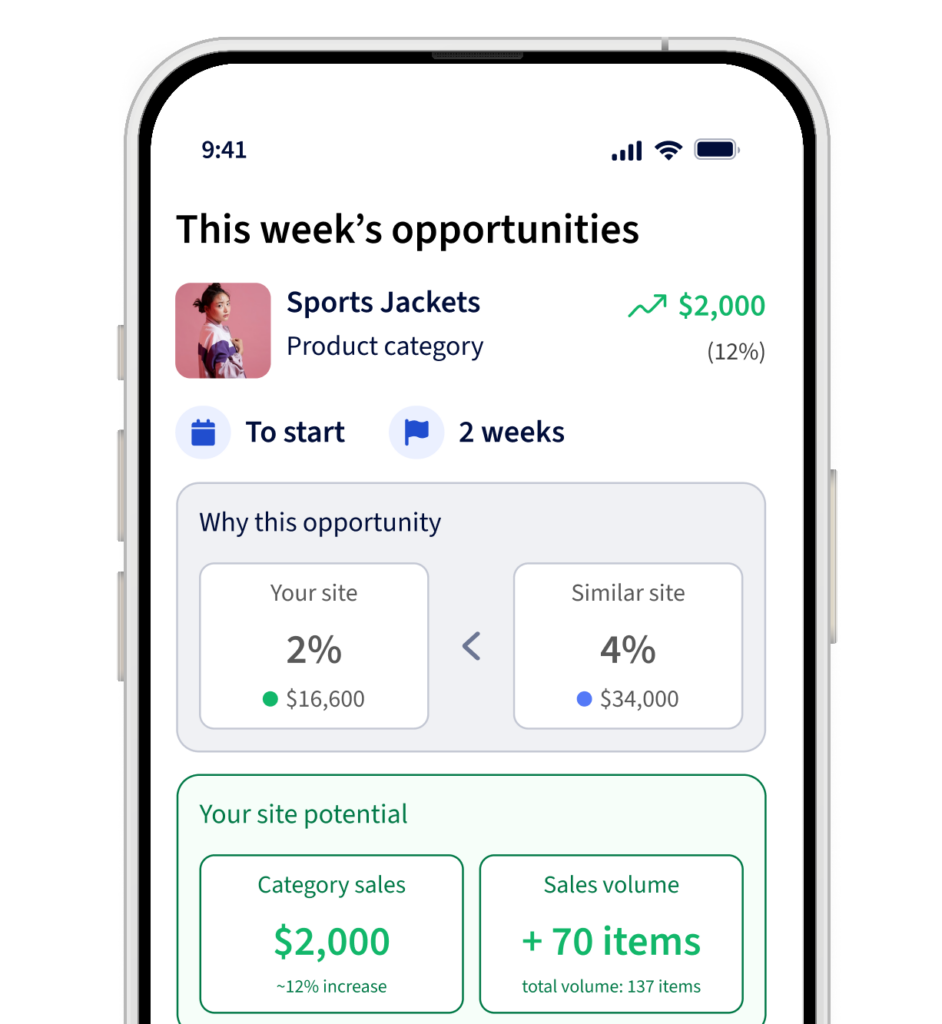
Store Manager Copilot benchmarks each store against genuinely comparable stores in the retailer’s own network. Similar format, similar operating conditions. Because of that, the system isolates the variance a manager can actually influence. That is the only kind worth putting in front of them, and the only kind worth turning into an action for the store team.
INSIGHT
A store compared to the chain average learns whether it is bigger or smaller than typical. A store compared to genuinely similar stores learns whether it is being run better or worse than it could be. Only the second is actionable.
Where inventory data forms part of the setup, detection is inventory-aware. So Store Manager Copilot does not recommend selling something the store does not have. That sounds obvious. Analytics-led approaches miss it constantly. A recommendation engine reading sales patterns alone has no reason to check the stockroom.
Step three: getting the action to a person on shift
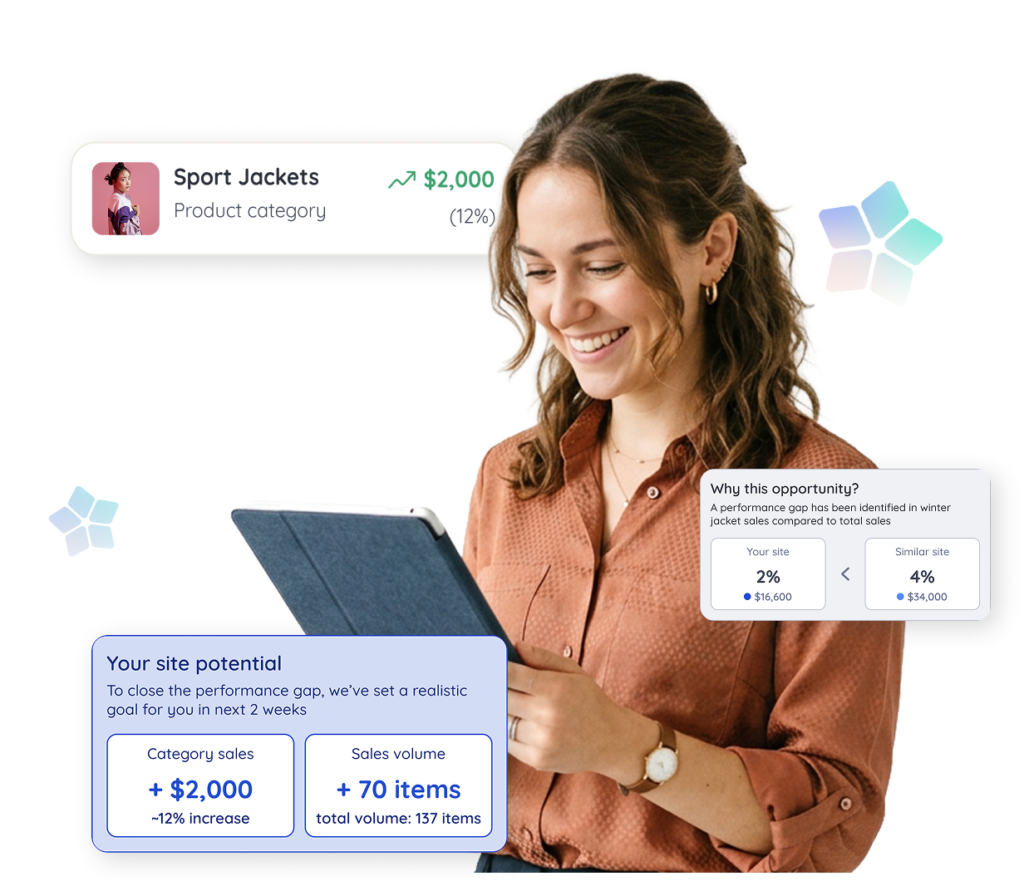
An opportunity is not a chart, though. In YOOBIC it is a first-class object. It carries its benchmark comparison, the store’s stock position, the expected KPI movement and the rationale behind it.
That opportunity feeds the recommendations section in Store Manager Copilot. It surfaces as a specific, ranked action for a manager to review and accept in one tap. Accepting a recommendation then builds an editable, AI-generated action plan. That might be a mission, a newsfeed post or a course for the store team. It can be added straight to the task list the store team already opens every shift, so there is no new login.
In practice, Morrisons shows what this does to a manager’s week. Weekly task volumes fell from 80 to 100 items per store manager down to roughly 10 targeted actions. Those actions route directly to the responsible department colleague rather than cascading through the store manager.
“The store manager is really busy. He or she has got a million things on their minds. Instead of spending all their time walking everything, they can prioritize now the things that they know aren't done, cuz they've got a prompt saying, 'Hey, I'm not done.' It gives us real-time visibility in the moment and also on the quality because we can actually be asking for pictures.”
Gordon Macpherson, Group Productivity Director, Morrisons
Fewer priorities, not a longer list
There is a temptation to treat a copilot as a way to push more work to stores faster. However, the research says that backfires.
Tan and Netessine, publishing in Management Science, established an inverted-U relationship between workload and productivity. Task volume lifts performance up to a threshold, then cognitive overload sets in and execution quality falls away. Later research on Zara stores found the same pattern with algorithmic direction. When managers received too many system-generated price and markdown instructions, they abandoned the system and fell back on instinct.
This is why prioritization has to mean subtraction. Three ranked priorities a day is a different product from a hundred tasks sorted by urgency. The difference shows up in completion rates rather than in the interface.
Step four: proving the action worked
Most reporting, though, is open-loop. It tells HQ an issue existed and leaves everyone guessing about what happened next.
Because the action stays linked to the recommendation, a manager tracks it through to completion. Performance moves visibly while they watch. A store manager can look back afterwards and see whether the action shifted the number. That closes the loop that dashboards leave open, and it is the step almost nobody in this category can demonstrate.
A separate dashboard built for HQ closes the same loop at network level. It shows which recommendations are offered, accepted, skipped or actioned across the estate. It shows which stores are converting recommendations into sales uplift, and by how much. It also shows which sites accept the most each week, and which are lagging. So the loop a store manager sees for one action, HQ sees for the whole network. That is proof of adoption and proof of return in a single view.
Michaels, for example, put a scale figure on the time this releases. Across 1,350 stores the company reclaimed 223,000 labor hours a year. That is about two and a half hours per store each week, alongside a 30% improvement in task completion rates.
223,000+ hours saved
annually across 1,350 stores after Michaels digitized store operations — 2.5 hrs per store per week. Task completion improved 30%. $1.8M in incremental revenue was generated.
YOOBIC case study, Michaels
Where the copilot stops and the manager starts
The honest answer is that the copilot does not make the decision, and it should not.
Harvard Business School researchers examined five years of scheduling data from a major grocery retailer. The study covered more than 500 stores, 100,000 employees and 29 million shifts. Managers overrode 72.9% of the schedules the algorithm produced. Although you might expect panic edits, these were not. They happened around three weeks ahead of the shift.
More importantly, the overrides were right. A one standard deviation increase in overrides drove an 8.22% rise in store labor productivity. Managers held local knowledge the algorithm treated as fixed, or never saw at all.
That finding shapes how a copilot should be built. YOOBIC’s position across its AI-powered performance products is augmented rather than autonomous. The system surfaces an explainable opportunity with its benchmark and supporting context. The manager then applies judgment about staffing, stock accuracy, a local event or a merchandising constraint. HQ keeps governance through configuration, rollout controls and full visibility into what was done and the financial impact it had.
Explainability therefore follows from the architecture rather than from a policy. The core engine is store similarity benchmarking, forecasting and feature engineering on real operational data. The language model writes the summary. It does not make the call.
What to ask before you buy
Category descriptions have converged, so specifics are the only way to tell products apart. Therefore four questions do most of the work.
Ask what the system compares a store against, and whether the answer is genuinely comparable stores or a network average. Ask whether recommendations check stock before suggesting a sell-through action. Ask who receives the action, in which app, and whether they already use it daily. Ask how the system shows that the action moved the number afterwards.
Vendors who can answer all four are describing a working loop. Vendors who answer only the first two are describing analytics. For the wider category picture, start with our guide to AI in retail.
Start retailing smarter
Frequently asked questions
What is an AI Copilot and how does it work?
An AI copilot is software that reads operational and performance data, decides algorithmically which problems are worth acting on, and turns those decisions into specific tasks for store teams. In retail it works in four steps: it reads store data such as sales, stock and foot traffic alongside execution records; it compares each store against genuinely comparable stores to find performance gaps a manager can influence; it converts the highest-impact gaps into ranked recommendations with editable, pre-built action plans; and it tracks each action through to completion so the resulting change in performance is visible. The distinction from a dashboard matters, because a dashboard reports what happened, while a copilot interprets the data and produces a recommendation based on signal evidence with an assigned action behind it.