Categories
Retail Training

Retail employee engagement: the five-system framework that drives store performance

Most retail engagement strategies treat motivation, recognition, feedback, engagement, and connectivity as five separate HR initiatives. That’s why most of them fail. They aren’t independent. They’re a single system, and a weakness in one pillar quietly drains the other four.

This piece names the system, shows how the five pillars interact, and gives retail operations leaders a practical way to spot where their own setup is breaking. By the end, you’ll have a diagnostic you can run against your own store network this quarter.

three women shopping and having fun

The paradox of presence and productivity

Retail organizations are technically more connected than ever. The tools are better. The data is richer. The frameworks are clearer. And yet store teams feel more disconnected from headquarters, more drained by the job, and more likely to leave than at any point in the last decade.

Globally, Gallup estimates that low employee engagement is costing the world economy around $10 trillion a year, roughly 9% of global GDP. That figure is global, not retail-specific. But retail carries disproportionate exposure to it: voluntary turnover in retail and wholesale sits between 26.7% and 32.9%, the highest of any major industry, and roughly three times the rate in insurance.

So why do most engagement programs barely move the dial? Because they treat the symptom, not the system.

fully stocked shelf

The five pillars of frontline experience, defined

Five interconnected pillars shape how a frontline retail employee experiences work. Together they form what we call the fractal frontline, a system where every pillar reinforces or weakens the others.

1. Motivation

Why someone shows up and gives discretionary effort. A mix of extrinsic drivers like pay and shift flexibility, and intrinsic drivers like purpose, mastery, and autonomy. Intrinsic motivation alone can lift discretionary effort by up to 76%.

2. Recognition

How performance and value are acknowledged. Frequent, specific recognition has a 0.455 correlation with engagement. Well-recognized employees are 45% less likely to have turned over two years later.

3. Feedback

The two-way flow of intelligence between frontline and HQ. Today only 36% of frontline workers feel they can give feedback, and only 9% believe their leaders are aligned with business goals.

4. Engagement

The outcome. The measure of enthusiasm and involvement. Global engagement now sits at 20%, a one-point drop from last year. The most engaged third of stores outperform sales targets while the least engaged third fall short.

5. Connectivity

The infrastructure underneath all of it. The flow of information, the accessibility of leadership, the strength of social bonds across a distributed network. Companies with highly connected employees report up to 25% higher productivity.

Why these are one system, not five

Picture one full cycle.

Connectivity is the prerequisite. Without a reliable way to reach store teams, you can’t gather feedback, deliver recognition, or share the context that makes the work feel purposeful. Frontline workers without consistent access to a single, reliable communication channel are effectively voiceless.

Feedback is what connectivity enables. When the channel works, store teams can flag what’s broken, suggest what could improve, and share what’s working. But feedback that goes nowhere is worse than no feedback at all. It signals that no one is listening.

Recognition is how you close the loop. When a manager visibly acts on feedback, or names a behavior that aligned with what the business needed, the employee learns that the work matters. That’s the moment recognition stops being a perk and starts functioning as an operational signal.

Motivation is the result. Not because of any single recognition moment, but because of the pattern. When the cycle runs reliably, store associates know their effort is seen, their voice carries, and their work connects to something larger than the till.

Engagement is the system’s output. It isn’t a thing you can install. It emerges when the other four pillars are working in concert.

retail manager using a tablet

Where the system breaks first: the manager

Five pillars, one system. So which pillar gives way first?

Almost always, it’s the manager.

Store managers govern roughly 70% of the variance in team engagement. They’re the only operational layer that touches customers, store associates, district leadership, and HQ in the same week. When the manager is strong, the system holds. When the manager is overloaded or disengaged, every pillar downstream collapses with them.

Globally, manager engagement just dropped from 31% to 22% in a single year. That’s the steepest fall on record. In retail, where the manager is the engagement governor for everyone below them, that drop translates directly into store execution failure: incomplete tasks, missed recognition moments, broken feedback loops, and store teams left to fill the gap themselves.

The fix isn’t another engagement campaign. It’s giving the manager the time, clarity, and tools to do the coaching work the role demands. That means stripping out the administrative load that buries them, narrowing the dashboards they’re expected to interpret, and giving them recognition and feedback rituals they can run inside the flow of work.

Michaels store associate leading a crafting activity at an in-store table with customers

What the system looks like when it works

Michaels: connectivity that powers everything else

When Michaels launched Mik Check, their custom mobile platform powered by YOOBIC, employee engagement jumped from 30% to between 80 and 90% within weeks. Voluntary turnover dropped by 24%. Learning program participation rose by 150%. Internal communities generated 13,700 posts with 1.5 million views.

None of those numbers belong to a single pillar. They show what happens when connectivity finally arrives at the frontline. Once store teams had a reliable way to receive context, give feedback, recognize each other, and learn in the flow of work, every other pillar moved at once.

“We barely got time to do things once, never mind twice or three times.“The hard part isn't getting the feedback. It's getting it back out to the field. We're committed to closing the loop, because we don't want anyone to think we listened and didn't do anything with it.”

Billy Kissel, on the Frontline Fridays podcast

Kissel’s point is the practical version of the fractal principle. Feedback that doesn’t loop back becomes the single point of failure for every other pillar. Recognition stalls. Trust thins. Motivation drains. The system breaks at the weakest connection.

Warehouse workers discussing with clipboard while working in warehouse

A diagnostic for retail operations leaders

If you want to know where your fractal frontline is breaking, ask five questions. One per pillar. Each one ties to an observable store-level signal you can check this week.

  • Motivation: Do your store teams know how today’s work connects to the wider business? If associates can’t articulate what their store is contributing to this quarter, motivation is leaking through a clarity gap.
  • Recognition: In the last 30 days, how many specific, named recognition moments has each store manager delivered? If the answer is fewer than one per associate per week, you have a recognition gap.
  • Feedback: When was the last time HQ made a visible change in response to frontline input, and was the change explicitly attributed to that input? If you can’t point to a clear example in the last quarter, the loop is open.
  • Engagement: How wide is the engagement spread between your top-quartile and bottom-quartile stores? A wide spread isn’t a sentiment problem. It’s a system problem isolated to a region or a manager cohort.
  • Connectivity: What percentage of your store associates received and acknowledged the most recent priority update from HQ within 24 hours? If you can’t measure it, that’s your starting point.

Each of these is something a retail operations leader can observe directly. The answers, in aggregate, tell you which pillar is buckling first.

Engagement is downstream of operational clarity

The retailers that win on engagement aren’t running bigger HR programs. They’re running tighter operational systems. They’ve understood that engagement is a result, not an intervention. You can’t add it. You build the conditions that produce it.

That’s why the most resilient retailers in 2026 are the ones investing in connected execution at the frontline. When store managers can act on the data in front of them, store teams can give honest feedback through a channel that reaches HQ, recognition lands the same day the behavior happened, and every associate understands how their store contributes to the wider business, engagement follows. Predictably and measurably.

This is why brands like Hugo Boss are seeing 3.2% sales uplifts from early deployments of AI-powered store manager tools. Not because the AI replaces the human work of engagement, but because it gives the manager the time and clarity to do that work properly.

The fractal frontline isn’t a model that lives on a slide. It’s the operational reality of every retailer who’s figured out that motivation, recognition, feedback, engagement, and connectivity aren’t five things to manage. They’re one thing to build.

Frequently asked questions

What is retail employee engagement?

Retail employee engagement is the measure of an employee’s enthusiasm, involvement, and emotional commitment to their work and their employer. In retail specifically, it predicts store-level sales performance, customer satisfaction, and voluntary turnover. The most engaged third of retail stores consistently outperform sales targets, while the least engaged third fall below them.

How are motivation and engagement different?

Why does manager engagement matter most in retail?

What does frontline disengagement cost retailers?

How is connectivity different from internal communications?

Looking for more on how retail leaders are rethinking frontline performance? Explore the YOOBIC platform, listen to Frontline Fridays, or read how Mattress Firm turned automation into an execution engine across stores.

Book a demo and find out how

Avoid wasted hours, blind spots
and lost revenue with YOOBIC

Frontline worker hero image
Categories
Operations Retail

5 ways to make your store walks drive real performance

Most retail organizations measure store walk effectiveness by visit frequency and audit scores. Both are the wrong metrics.

A store walk that produces a clean scorecard on visit day but changes nothing in the following three weeks has not driven performance. It has generated paperwork.

This gap between audit activity and real execution is a common challenge in modern retail operations, especially as cost pressures increase.

The good news: the fixes are structural, not cultural. Here’s what high-performing field teams do differently and how to build it into your own program.

1. Measure what changes between visits, not what scores on the day

Audit scores tell you how a store performed on one specific day — often a day when the team knew the visit was coming. They tell you almost nothing about execution on day two, day fifteen, or day twenty-six.

The real measure of a store walk is its impact on the days when no one is watching. Research from StoreForce confirms this: when a store visit follows a structured observe-assess-act framework, it produces a measurable lift in conversion rate from 15.2% to 15.8% on visit day and an average basket size increase of $2.21 per transaction.

High-performing retailers track action completion rates alongside audit scores, because completion is what converts a finding into an outcome.

Execution consistency at this level depends heavily on how well operational data is captured and acted on across stores.

Tracking completion alongside performance is critical to understanding how operational execution translates into sales outcomes.

KEY STAT:

90% vs 60%

Self-reported compliance vs. actual floor reality — the gap most retailers are not measuring. (Xenia)

The question to ask of any store walk program is not how many stores were visited last month. It’s: what changed in those stores as a result?

For a deeper look at how leading retailers structure their measurement systems, see our complete guide to retail store walks in 2026.

2. Build a follow-up system that actually closes the loop

Most store walks successfully identify issues. The opportunity is in what happens next.

When issues are identified but not assigned to a named owner with a deadline and a verification requirement, they don’t get resolved. Without clear accountability, the same failures resurface in every audit for months.

It’s also worth separating compliance problems from root cause failures. If a field leader identifies a consistently messy endcap and assigns a tidy-up task, they’ve treated the symptom. If they don’t investigate why it keeps happening — unclear planogram instructions, insufficient replenishment time, a confusing backroom layout — the symptom returns at the next visit. Recurring issues rarely signal a lack of effort. They signal a process that was never properly diagnosed.

Digital task verification, with photo proof and timestamps, replaces self-reporting with verifiable evidence. When a field manager marks an item non-compliant and the system immediately generates an assigned task with a deadline and a photo requirement for closure, the gap between observation and correction narrows from days to hours.

KEY STAT:

43%

Increase in time spent on revenue-focused activity — reported by organizations using structured digital task management.

That return is not driven by better checklists. It’s driven by a follow-up system that consistently closes the loop.

See how Morrisons reduced weekly task volumes from 80–100 items to approximately 10 targeted actions per manager by rebuilding exactly that system.

3. Schedule visits based on need, not geography

Most district managers visit stores on a fixed calendar. It’s predictable and easy to plan — but almost entirely disconnected from where performance problems are actually happening.

Top performers use real-time dashboards to identify which stores are falling below compliance thresholds or experiencing conversion anomalies. Their visit schedule is determined by where the intervention will have the most impact.

KEY STAT:

5x–9x

Project return in year one for organizations that adopt structured digital task management.

Exception-based scheduling means visit time is directed at the stores that need it most. It’s a straightforward shift that compounds over time.

For a closer look at how area managers are restructuring their time across larger territories, see our breakdown of the area manager role in modern retail.

4. Spend more time coaching associates, less time with the store manager

The most significant in-visit behavior difference between average and high-performing district managers isn’t preparation or checklist quality. It’s who they spend time with on the floor.

Average DMTop-performing DM
Fixed visit rotationData-driven, exception-based scheduling
Checklist verification focusBehavioral coaching on the floor
Speaks mainly to the store managerEngages and coaches associates directly
Manual follow-up remindersDigital task tracking with SLA adherence
Reviews old sales reportsActs on real-time execution and traffic signals

Average DMs spend the majority of their visit with the store manager. Top performers engage and coach associates directly on the sales floor — because those are the people delivering the customer experience. Real-time coaching improves associate performance by up to 12%, with a direct correlation to sales growth.

A day in the life of a connected area manager shows what this looks like at ground level.

Elite leaders also protect store capacity rather than adding to workload. When HQ launches a promotion that requires additional merchandising labor, a top-performing DM evaluates whether the store can absorb it alongside existing tasks and pushes back when it can’t. A mandate that exceeds store capacity won’t be executed regardless of how clearly it’s communicated.

UNTUCKit saw this play out directly. By reducing administrative overhead through digital execution, market managers shifted from three in-store days per week to four — a 33% increase in time spent on the floor, where performance is actually driven.

Read the full UNTUCKit case study here

5. Use technology to narrow the gap between finding and fix

Technology improves store walks not by generating more data, but by narrowing the time between a finding and a correction. A system that produces a comprehensive report three days after a visit is not solving the execution problem. It’s documenting it.

The most valuable capability modern execution platforms provide is a proof layer: photo verification and timestamps that replace self-reported compliance with verifiable evidence. Pencil-whipping, marking tasks complete without verifying them, is a structural response to time pressure and absent verification. A proof layer eliminates it structurally.

Beyond follow-up, AI and computer vision tools are changing what field leaders arrive knowing. Platforms can now:

  • Detect planogram deviations and out-of-stocks before a human auditor enters the store
  • Analyze historical audit trends and task completion rates to surface which stores are at risk of operational slippage
  • Direct visit schedules based on anticipated need rather than a fixed rotation

The technology doesn’t replace field leadership judgment. It removes the administrative friction that prevents that judgment from being applied where it matters most.

Every retail organization conducts store walks. The ones that drive consistent performance treat the visit as the start of an execution cycle, not the completion of a compliance obligation. That’s where the performance gap lives — and that’s where it has to be closed.

Book a demo and find out how

Avoid wasted hours, blind spots
and lost revenue with YOOBIC

Frontline worker hero image
Categories
Operations Retail Training

Why retail employees quit in their first year and how to stop it

Retail loses more employees in their first year than almost any other industry. The pattern repeats across store formats: new hires arrive, get a rushed orientation, struggle through their first few weeks, and quietly disappear before they ever hit their stride.

The cost goes beyond another job posting. Every early departure drains recruiting budgets, wastes training hours, and leaves remaining staff stretched thin. This article breaks down the specific reasons retail employees quit in their first year, how to spot the warning signs in your own stores, and the practical steps that keep more new hires past the twelve-month mark.

The scale of first year turnover in retail

Retail employees frequently leave within the first year due to a combination of low wages, poor management, and misalignment between job expectations and reality. High-stress environments, inadequate training, and lack of career growth opportunities compound the problem. Many departures happen within the first 90 days.

First year turnover, sometimes called new hire attrition, measures the percentage of employees who leave before completing twelve months on the job. Employee turnover in retail runs higher than most industries on this metric, reaching 26.7% voluntary turnover according to Mercer’s 2025 survey, and the pattern holds across store formats. Whether you operate specialty retail, big-box locations, or quick-service restaurants, the first year is when you lose the most people.

The true cost of losing new hires in their first year

Every early departure carries costs that go far beyond posting another job listing. Replacing a single frontline worker costs approximately 40% of their annual salary, and the real impact shows up across recruiting, training, productivity, and customer experience, often as hidden costs that are hard to see until you add them up.

  • Recruiting and hiring costs: Job postings, interviews, background checks, and HR time accumulate quickly when you repeat the process for the same role.

  • Training investment lost: The hours spent onboarding a new associate walk out the door with them.

  • Productivity gap: Replacement hires take weeks to reach baseline performance, leaving teams short-handed.

  • Team morale impact: Remaining staff carry extra workload, which increases their own risk of burnout and departure.

  • Customer experience: Inexperienced teams deliver inconsistent service, which affects sales and brand perception.

A single location losing three associates in their first year might absorb the hit. Multiply that across hundreds of stores, and the financial and operational drag becomes significant.

Why retail employees quit in their first year

Most new hires leave not because of pay alone, but because of how the job feels in those first weeks and months. The reasons tend to cluster around a few recurring themes, and understanding them is the first step toward addressing them.

Poor onboarding and inconsistent training

Onboarding in retail often gets compressed into a single shift. New hires shadow whoever happens to be available, then get put on the floor before they feel ready. This sink-or-swim approach creates anxiety and mistakes.

Associates who feel unprepared are more likely to disengage early. Structured training paths delivered on mobile devices, accessible in the flow of work, help new hires build confidence without pulling them off the sales floor for hours at a time.

A gap between the job description and the store floor

Expectation mismatch happens when the interview promises one reality and the job delivers another. Enboarder’s 2025 research identified it as the leading reason new hires leave early. This erodes trust fast, and once trust is gone, so is the employee.

Common mismatches include:

  • Promised set schedules, but received last-minute changes

  • Described as customer-facing, but assigned to stockroom duties

  • Told about growth opportunities, but no one explains how to advance

When the job feels like a bait-and-switch, new hires start looking elsewhere within weeks.

Unpredictable scheduling and long hours

Erratic schedules make it impossible to plan life outside work. Frontline workers consistently cite scheduling as a top frustration. The issue is not about working hard. It is about knowing when you work.

Centralized communication tools that give associates visibility into upcoming shifts reduce the chaos and help people feel more in control of their time.

Low pay and thin benefits

Pay matters, though it rarely acts alone. Compensation becomes the final reason to leave when nothing else compensates for a chaotic, unsupportive, or exhausting work environment.

Retailers competing for talent often find that modest pay increases combined with better working conditions outperform higher wages paired with poor management.

Disconnected store managers and a lack of coaching

Store managers are often too overloaded with administrative tasks to coach new hires. Reports, compliance checks, and firefighting consume the hours that could go toward developing people.

The result is that new employees feel ignored. They make mistakes without feedback and never learn what good performance looks like. When managers have access to prioritized daily actions and performance insights, they can shift time from spreadsheets to their teams.

No clear path to growth or promotion

New hires who see no future leave to find one elsewhere. Career development in retail often feels invisible, with no clear steps from associate to supervisor.

What “no path” looks like in practice:

  • No one explains what it takes to get promoted

  • No skills tracking or recognition of progress

  • High performers treated the same as everyone else

Associates who understand the steps from their current role to the next one are more likely to stay and work toward it.

Feeling invisible to HQ

Frontline workers often feel like numbers rather than people. Feedback goes nowhere. Company news arrives late or not at all.

This disconnect is not usually about a lack of caring at headquarters. It is about a lack of connection. Internal communications platforms that create two-way channels between stores and HQ help associates feel heard and informed.

Outdated tools that make the job harder

Paper checklists, scattered apps, and manual processes slow associates down. New hires notice when they spend more time fighting systems than helping customers.

The frustration compounds when different tools do not talk to each other. A unified platform that brings tasks, communications, and learning into one place removes friction and lets people focus on the work itself.

How to diagnose where new hires drop off in your stores

Fixing turnover starts with understanding when and where it happens in your own organization. The data often reveals patterns that are not obvious from the surface.

Map attrition by store, role, and tenure

Segment your turnover data to find patterns. Are certain stores losing more people? Are specific roles, like cashier versus stockroom, more vulnerable? Does turnover spike at week two or month three?

This analysis reveals where to focus your efforts first.

Run stay interviews at thirty, sixty, and ninety days

Stay interviews are conversations with current employees to learn what is working and what is not, before they decide to leave. Unlike exit interviews, they come early enough to act on.

Sample questions to ask:

  • What surprised you about this job?

  • What almost made you quit?

  • What would make you stay longer?

Track onboarding completion and early task performance

Completion rates for training modules and first tasks reveal engagement. Low completion signals disengagement or poor program design.

Digital learning platforms track this automatically, giving you visibility without adding manual reporting to your managers’ workload.

Capture frontline feedback in real time

Pulse surveys and quick polls embedded into daily workflows surface issues while you can still address them. Waiting for annual surveys misses the window.

Internal communications tools with built-in feedback features help HQ hear from the floor without creating extra steps for store teams.

How to stop first year turnover in retail

Employee retention is not one big fix. It is a series of small decisions that add up over the first weeks and months.

1. Rebuild onboarding as a structured ninety day program

Effective onboarding extends well beyond day one. A structured program gives new hires time to learn, practice, and build confidence before they are expected to perform at full speed.

  • Week one: Orientation, culture, core systems

  • Weeks two through four: Role-specific training, shadowing, first tasks with feedback

  • Months two and three: Check-ins, skill-building, ongoing learning

Mobile-first learning platforms make this scalable across hundreds of stores without requiring in-person sessions.

2. Set honest expectations during hiring

Overselling the role creates the mismatch problem. Hiring managers who describe the real pace, challenges, and opportunities attract candidates who are more likely to stay.

Cover scheduling realities, physical demands, career path, and team culture during the interview process. Honesty upfront saves turnover later.

3. Deliver training in the flow of work

Pulling associates off the floor for long training sessions is impractical in most retail environments. Training works better when it is embedded into daily tasks, accessible on mobile, and delivered in short bursts.

Think of it as learning on the sales floor, not in a classroom.

4. Give store managers time and tools to coach

Coaching requires margin. If managers spend hours on admin and reporting, they cannot develop their teams.

When managers receive prioritized daily actions and performance insights through tools like AI-powered copilots, they can shift time from spreadsheets to people. The difference shows up in how new hires feel supported.

5. Recognize wins early and often

Recognition in the first months reinforces belonging. This does not require formal programs, just visible acknowledgment of progress.

  • Shoutouts in team communications

  • Badges or milestones for completing training

  • Manager check-ins that highlight what is going well

6. Fix scheduling and communication gaps

Giving associates more visibility into their schedules and a single place to receive updates reduces chaos. Centralized communication platforms cut email overload and ensure messages reach the right people at the right time.

7. Open a clear career path from day one

Document the steps from associate to supervisor to manager. Make skills and milestones visible. Learning platforms with progress tracking and skill gap analysis help associates see their own development and understand what comes next.

How store managers shape new hire retention

The store manager is the single biggest influence on whether a new hire stays or goes. People leave managers, not companies, and this is especially true in retail where the manager sets the tone for daily work.

What effective managers do differently:

  • They check in regularly: Not just when something is wrong

  • They clarify expectations: New hires know what success looks like

  • They advocate for their team: They surface issues to HQ and push for resources

  • They coach, not just correct: Feedback is developmental, not punitive

Managers need support too. Investing in manager development, practical tools, and realistic workloads makes the difference between a manager who develops people and one who barely keeps up.

How to measure and track first year retention

Tracking the right metrics over time reveals whether your retention efforts are working. Here are the key numbers to watch:

Metric

What it measures

Review frequency

First year turnover rate

Percentage of new hires who leave within twelve months

Monthly

Turnover by tenure band

When departures happen (first week, first month, first quarter)

Monthly

Onboarding completion rate

Percentage of new hires who finish training

Weekly

Engagement survey scores

How new hires feel about their experience

Quarterly

Store-level attrition variance

Which locations have higher or lower turnover

Monthly

Turn every store into a place new hires want to stay

First year turnover is not inevitable. It results from gaps in onboarding, communication, management, and tools that compound over the first weeks and months.

Retailers who close these gaps keep more of the people they hire and build stronger, more consistent teams. The work is not glamorous, but the payoff shows up in lower recruiting costs, better customer experience, and stores that actually have the staff they need.

For brands looking to reduce first year turnover through better onboarding, communication, and manager enablement, YOOBIC brings everything together in one platform.

Book a demo and find out how

Avoid wasted hours, blind spots
and lost revenue with YOOBIC

Frontline worker hero image

Frequently asked questions about retail first year turnover

Why do retail workers quit in their first year?

Most retail workers quit in their first year due to poor onboarding, misaligned expectations, lack of manager support, unpredictable scheduling, and no visible path to growth. Pay is a factor, but rarely the only one.

What are signs a new retail employee is about to quit?

What is the three month rule for new retail jobs?

What is a healthy first year turnover rate for retail?

How long should retail onboarding last?

Categories
Operations Retail

Store visits are a revenue lever. Here’s the data to prove it.

The debate about store visits almost always centres on frequency. How often should a district manager visit? How long should a walk take? What should be on the checklist?

These are the wrong questions.

The right question is: what did the visit change? Not in terms of boxes ticked, but in terms of revenue recovered, margin protected, shrink reduced, and execution improved. A visit that cannot answer that question is a cost with no return.

This article builds the business case for store visits as a financial performance instrument. Every section is anchored to measurable outcomes: conversion rates, cost structures, and the direct commercial consequences of execution quality. The evidence is unambiguous. Retailers who measure store visits by impact — not activity — generate returns that run to tens of millions of dollars per year. Those who do not leave that value on the table.

The execution gap is costing retailers billions — and most can’t see it

The global retail industry loses an estimated $1.8 trillion every year to inventory distortion. That figure reflects two compounding failures: products absent from the shelf when a customer is ready to buy, and products on the shelf that customers do not want. Together, they represent the largest single source of preventable loss in physical retail.

Out-of-stocks alone account for $634.1 billion in lost revenue globally. Overstock and markdowns add a further $450 billion. Carrying costs for excess inventory reach 20 to 30 percent of inventory value annually.

The natural assumption is that these are supply chain failures. Research consistently refutes this. Between 70 and 90 percent of stockouts are caused by in-store execution breakdowns — incorrect replenishment, poor stock rotation, and shelf maintenance failures — not upstream constraints. The problem is not what arrives at the store. It is what happens to it once it is there.

The financial consequences extend beyond the missed transaction. When a product is unavailable, 91 percent of customers will not wait for it to be restocked. They purchase from a competitor or abandon the category entirely. For high-velocity items, a single execution failure generates thousands of dollars in lost sales per store per week. In grocery, where margins are thin, a stockout on a high-margin item destroys more profit than the visible revenue loss suggests. The associated labour cost — associates fielding customer queries about empty shelves — is estimated at $800 per week for a typical U.S. grocery store.

At organisation level, the cost compounds into a structural problem. The execution gap — the annual financial cost of strategy failing to translate into consistent in-store performance — is estimated at $10 million to $40 million per large retailer per year.

MetricFinancial impact (USD)Primary mechanism of loss
Global inventory distortion$1.8 trillionCombined out-of-stocks, overstock, and process failures
Out-of-stock revenue loss$634.1 billionLost transactions and customer defection to competitors
Overstock and markdowns~$450 billionTrapped capital and margin erosion from discounting
Global shrinkage$100+ billionInternal/external theft and operational errors
Retail execution gap (per large retailer)$10M–$40M per yearStore-level failures in strategy implementation

The majority of this loss is recoverable. The mechanism is not a new strategy or a new technology. It is more precise execution at the store level — and a fundamentally different approach to the visits intended to drive it.

Why store visit ROI is determined by outcomes, not activity

A store visit that identifies 100 execution gaps and resolves none of them has a negative ROI. The labour cost is real. The return is zero. This is not a hypothetical risk — it is the default outcome in any organisation that measures field leadership by volume of visits rather than verified change.

In a study of 9,064 visits across 3,174 stores, actionable follow-through — not visit frequency — was the single most important differentiator between visits that drove measurable revenue gains and those that did not.

Coverage across the estate matters for visibility. But visiting 83 percent of stores uniformly does not produce uniform returns. The highest financial return comes from directing visit intensity toward underperforming stores — specifically those scoring below 50 percent on execution assessments. These are the locations where a single focused visit, with full action plan resolution, captures disproportionate commercial value.

The cost of the backstopping trap

The most commercially damaging pattern in retail field leadership is the backstopping trap: a manager who spends their visit correcting frontline errors rather than building the team’s capability to prevent them.

McKinsey and Deloitte research quantifies this precisely. Top-quartile leaders spend approximately 50 percent more time on development and delegation than on direct problem-solving. Their teams outperform peers by a factor of two on revenue growth. Managers who backstop create dependency. Managers who coach create compounding performance improvement.

The commercial question that must follow every store visit is not: what did I fix? It is: what will not break again?

Activity vs. outcome: what the right measurement model looks like

DimensionActivity-based modelOutcome-based model
Primary metricNumber of visits completedRevenue or KPI change attributed to visit
Success criteriaVisit occurred on scheduleAction plans closed at 100% completion
Reporting focusCoverage rate across estateExecution score improvement by store
Leadership behaviourProblem-solving during the visitCoaching and capability building
Follow-upObservations notedStructured resolution with deadlines and evidence
ROI indicatorVisits per district per weekSales lift, OSA delta, shrink rate movement

Retailers that shift to outcome-based measurement do not necessarily increase visit frequency. They increase visit precision. The financial return reflects the difference.

The sales impact of a structured store walk

Sales reports routinely obscure conversion problems. A store can show stable revenue while conversion rate has quietly deteriorated — because more customers are entering but fewer are buying. The revenue figure masks the trend. A structured store walk, focused on in-the-moment execution, surfaces what reporting cannot.

Structured execution programmes deliver conversion rate lifts of 0.6 percentage points and basket size increases of $2.21 per transaction. Applied across hundreds of stores and thousands of weekly transactions, these are not marginal gains.

The ‘Power of 1 Percent’ captures the compounding effect: converting just one additional customer in every 100 who enters a store produces profitability gains that outpace the labour cost of the visit that drove the improvement. This is the financial logic that makes store visits a revenue instrument, not a management ritual.

Conversion rate as a floor-level execution metric

Conversion rate is commonly treated as a traffic and marketing variable. It is, in practice, a direct function of floor-level execution. Associate availability during peak hours, greeting behaviour, display clarity, and fitting room management all determine whether a browsing customer completes a transaction.

A greeting delivered within 30 seconds of customer entry measurably increases purchase likelihood. Organised displays improve sales per square foot. Neither a sales report nor a remote dashboard identifies these gaps. Physical presence during trading hours — or AI-driven monitoring of associate-customer interactions — is the only mechanism that does.

Basket size and visual merchandising compliance

Merchandising compliance directly increases average basket size. Retailers applying structured execution programmes have recorded sales lifts of up to 20 percent attributable to consistent planogram compliance and promotional display execution alone.

The case evidence is consistent. Boggi Milano achieved a 5 percentage point conversion lift through structured in-store field leadership and real-time intelligence. Camper delivered a 10 percent conversion increase while reducing marketing spend by 30 percent — not by acquiring more customers, but by improving what happened to the ones already in the building.

Performance metricMeasured impact
Average basket size growth+$2.21 per transaction
Conversion rate lift — structured programmes+0.6 percentage points
Conversion lift — Boggi Milano+5.0 percentage points
Visual merchandising complianceUp to +20% sales lift
Camper: conversion improvement with cost reduction+10% conversion; -30% marketing spend

The pattern across these cases is consistent: retailers who treat the store walk as a sales performance intervention — not a compliance check — generate outcomes that are both measurable and repeatable.

On-shelf availability: the most direct revenue lever in physical retail

On-shelf availability (OSA) is the most financially sensitive execution variable in physical retail. A 1 percent improvement in OSA lifts total sales by 20 to 35 basis points. For a retailer generating $500 million in annual revenue, that is $1 million to $1.75 million in incremental sales from a single percentage point of improvement.

A 4 percent OSA decline reduces category sales by 2 to 3 percent. Below 95 percent OSA, losses become both significant and compounding. Stores operating below this threshold are not at risk of revenue loss — they are actively generating it.

Between 70 and 90 percent of stockouts are caused by in-store execution failures: replenishment delays, incorrect stock rotation, and shelf maintenance breakdowns. This matters commercially because it means availability is within direct operational control. It does not require supply chain investment. It requires consistent, verifiable store-level execution.

Phantom inventory: the silent revenue drain

The most insidious availability failure is phantom inventory — the inventory system records a product as in stock, but the shelf is empty due to theft, misplacement, or administrative error. Up to 60 percent of retail inventory records contain inaccuracies. Phantom inventory is a direct consequence.

Manual audits are retrospective. By the time the discrepancy surfaces through a periodic count, the revenue is already lost. Modern execution platforms using computer vision deliver continuous shelf monitoring and alert staff to replenishment needs before they reach critical thresholds. A mid-size grocery chain deploying real-time shelf alerts maintained above 98 percent OSA during peak trading hours, driving double-digit category sales growth as a result.

OSA changeSales impactCommercial implication
+1.0% OSA improvement+20–35 basis points in total salesEvery percentage point recovered is worth millions at scale
-4.0% OSA decline-2% to -3% in category salesCompounding weekly revenue loss per underperforming store
Below 95% OSA thresholdSignificant, measurable revenue lossRequires immediate store-level intervention
AI shelf monitoring deploymentUp to 40% reduction in lost salesContinuous coverage replaces retrospective auditing

The store walk is the primary human intervention point for OSA — most effective when informed by real-time data that tells the field leader exactly where to act, rather than requiring a manual scan of the entire floor.

Shrink is a margin problem, not a security problem

U.S. retailers lose over $100 billion annually to shrinkage. The standard response is to increase security investment. The data argues for a different intervention. The majority of retail shrink is not caused by theft. It is caused by operational failure — and operational failure is corrected through better execution management, not better security.

In the supermarket sector, up to 64 percent of shrinkage is driven by process breakdowns: cashier errors, administrative failures, and poor inventory handling. External theft accounts for just 28 percent.

This reframes shrink from a security budget problem to an execution management problem, and significantly changes the ROI calculation for store visits. A field leader who targets operational shrink sources during a structured walk is performing a margin protection function with a direct and calculable financial return.

Where shrink actually comes from

Source of lossContribution to total shrinkPrimary mechanism
External theft (shoplifting)28%Customer-facing; partially deterrence-dependent
Internal theft (employee)25%Process controls and leadership oversight
Cashier-caused operational errors11%–24%POS audit and transaction monitoring
Administrative and accounting errors4%–8%Inventory record accuracy
Perishables and product handling8%–9%Operating standards and training reinforcement

At point of sale, research shows 21 operational errors occur for every single incident of intentional theft. Auditing void rates, price overrides, and no-sale drawer openings during a store walk directly targets this ratio — and reduces it through accountability, not security spend.

The bottom-line equivalence that reframes the argument

Reducing shrink by 18 percent delivers the same bottom-line profit impact as a 22 percent increase in sales. In low-margin retail, that equivalence makes shrink reduction one of the highest-return activities a field leader can prioritise.

Top-performing store managers — those in the top 20 percent — achieve 26 percent lower shrink than their peers. The differentiator is not technology or security investment. It is rigorous application of written operating standards and consistent operational oversight during store visits.

Every visit that fails to audit operational shrink sources is a margin recovery opportunity foregone.

Pricing accuracy directly determines gross margin

Pricing errors are the most assumption-driven form of margin leakage in physical retail. Operators assume pricing is correct because systems have been updated. The assumption is wrong more often than most organisations track. Up to 60 percent of retail inventory records contain inaccuracies — and pricing tag discrepancies correlate directly with this figure.

A 1 percent increase in price realization produces an 8.7 percent increase in operating profits. This is one of the highest leverage ratios available in retail operations — and it is driven by execution at the shelf, not by commercial strategy.

Leakage occurs through multiple channels simultaneously. Shelf tags that do not reflect recent price increases mean customers are charged below the intended margin. Promotions that stack incorrectly compound discounts beyond the planned floor. Scan file errors create legal exposure as well as financial loss. And products that are obscured or cluttered generate no sales at any price.

How margin leakage occurs in practice

Leakage sourceMechanismCommercial impact
Outdated shelf tagsPrice increase or promotion end not reflected on shelfCustomer charged at old price; intended margin foregone
Incorrect promo stackingMultiple discounts applied simultaneously in errorCompound erosion below the planned margin floor
Scan file errorsPOS price differs from shelf priceRegulatory exposure and customer trust damage
Silent leakageProducts obscured or cluttered, generating zero visibilityFull-margin sales missed at the intended price point

The scan-to-shelf audit — comparing POS pricing against physical shelf tags — is among the highest-return activities conducted during a store walk. It is also among the most frequently skipped, because pricing is treated as a systems issue. It is not. It is a floor-level execution issue with a direct gross margin consequence.

Beyond the financial loss, pricing errors erode customer trust. Research shows 91 percent of customers rank brand reliability as a primary purchasing consideration. Frequent discrepancies — whether the customer is overcharged or discovers a gap post-purchase — signal unreliability and reduce return visit intent. Pricing accuracy is simultaneously a margin strategy and a customer retention strategy.

Frontline coaching during store visits drives measurable profitability

High employee engagement produces a 21 percent increase in profitability (Gallup). Organisations with intensive training programmes report profit margins 24 percent above peers. These are structural performance differentials — and store visits are the primary mechanism through which field leaders create them.

Real-time performance coaching during store visits produces a 12 percent boost in individual employee performance. This is not a development benefit. It is a direct revenue variable.

The mechanism is task clarity. When frontline associates know precisely what is expected, when it is due, and that it will be verified, execution rates rise sharply. Without that clarity, the data is stark: only 29 percent of retail initiatives are executed correctly at store level when communicated through traditional channels — email, printed briefings, verbal handovers.

Task completion as an execution multiplier

Structured digital task management raises execution rates to 95 percent or above. Office Depot achieved a 90 percent task completion rate following its transition to cloud-based task management — and reduced payroll costs by 6 percent annually as a direct consequence of the execution efficiency gained.

The gain is not just in completion. It is in verifiability. When tasks are confirmed with evidence — photo, GPS, timestamp — accountability becomes structural rather than interpersonal. Execution no longer depends on individual conscientiousness. It becomes a system property.

Training reinforcement and the compounding ROI effect

Retail training investment deteriorates rapidly without reinforcement. Knowledge acquired in a training session decays by up to 70 percent within a week in the absence of structured reinforcement in the working environment.

Store visits are the primary delivery mechanism for that reinforcement. Field leaders who embed training application into their visit behaviour — testing skill use in context, providing immediate feedback, correcting in the moment — generate a training ROI three times greater than those who conduct visits without reinforcement.

Behavioural driverMeasurable outcome
High employee engagement+21% increase in profitability (Gallup)
Intensive training programmes+24% higher profit margins vs. peers
Real-time performance coaching+12% boost in individual employee performance
Digital task management vs. traditional communicationExecution rate: 95%+ vs. 29%
Training reinforcement embedded in store visits3x greater ROI on training investment

The store visit, used as a coaching and reinforcement mechanism, does not simply improve individual performance. It multiplies the financial return on every other investment the organisation has made in its people.

Technology multiplies store visit ROI — at the execution layer, not the reporting layer

Retail execution technology does not replace the store visit. It makes every visit more precise, more accountable, and more financially productive. The critical distinction is where the technology operates. Reporting and dashboarding tools improve visibility. Execution layer tools — digital task management, computer vision, real-time orchestration — close the loop between observation and verified action.

For every $1 invested in process clarity and operational design, organisations save $5 to $10 downstream through reduced errors, rework, and wasted labour. This is the ROI case for execution technology — and it sits inside the execution gap cost it closes.

The execution gap ($10M to $40M per large retailer annually) is not closed by better insight. It is closed by better follow-through: knowing that the right task was completed, by the right person, at the right time, with evidence to confirm it. That is the standard digital task management enables — and the standard that determines whether a store visit generates a return or a cost.

What each technology class delivers commercially

Technology classOperational effectFinancial impact
Computer vision (e.g. Focal, Vispera)Continuous shelf auditing and anomaly detection4% lift in OSA; measurable reduction in operational shrink
Digital task management (e.g. YOOBIC, Zebra)Verified compliance with photo and GPS confirmation70%–99% execution consistency vs. ~29% via traditional methods
Real-time retail intelligence (e.g. RetailNext)Traffic-to-purchase behaviour correlation in real time$6M sales lift in 7 months — Vitamin Shoppe
Intelligent orchestration (e.g. YOOBIC, Quorso)Automatic prioritisation of highest-impact tasks43% increase in revenue-focused field activity

The Vitamin Shoppe result — $6 million in sales lift over seven months — was not driven by increased customer acquisition. It was driven by better conversion of existing traffic through more precise, real-time field direction. The technology identified where to act. The execution determined the outcome.

The hidden labour cost of poor execution systems

Organisations transitioning from manual, email-based task management to structured digital systems reduce unplanned overtime by 40 percent. The cause is straightforward: when tasks are unclear, untracked, or duplicated, reactive fire-fighting fills the gap. Digital execution systems eliminate the ambiguity that generates that fire-fighting.

The time recovered does not disappear. It redirects to customer-facing and coaching activity — the behaviours that produce the financial outcomes documented throughout this article. Better execution systems do not just reduce cost. They reallocate the most valuable resource in the store: attention.

A framework for calculating store visit ROI

The financial return on store visit investment is calculable using data most retailers already hold. The framework below organises that data across four commercial levers. Each lever represents a distinct and independent source of return — meaning the aggregate ROI of a well-executed store visit programme compounds across all four simultaneously.

The four levers of store visit ROI

LeverKPIVisit mechanismBusiness outcome
RevenueConversion rate, basket sizeMerchandising compliance, associate coaching, OSA maintenanceDirect sales lift; improved revenue per visitor
MarginPrice realization, promo accuracyScan-to-shelf audits, tag and promotion verificationGross margin protection; reduced revenue leakage
ShrinkShrinkage rate, POS error rateOperational audit, high-risk transaction reviewBottom-line equivalence to significant sales growth
ProductivityTask completion rate, training retentionCoaching, reinforcement, digital task follow-upMultiplied training ROI; reduced overtime and rework

Performance-to-potential modelling: directing visits for maximum return

Not every store generates the same return from a visit. The highest commercial return comes from directing visit intensity toward stores where execution — not structural factors like location, size, or local competition — is the primary constraint on performance.

ApproachAnalytical questionCommercial purpose
Simple benchmarkingHow does this store compare to the average?Identifies obvious underperformers in the fleet
Peer-based groupingHow does it compare to structurally similar stores?Sets realistic, context-appropriate targets
Potential modellingWhat should this store realistically deliver?Sizes the execution gap to direct visit investment

Potential modelling is the most commercially precise approach. It separates stores where a field leader’s visit moves the needle from stores where structural factors are the dominant constraint. Visit resources allocated accordingly generate measurably higher financial returns than uniform coverage.

The non-negotiable condition for positive ROI

Across all four levers, one variable determines whether a visit generates a return or a cost.

A visit that reaches 100 percent action plan completion generates measurable financial return across every lever. A visit that produces observations without structured resolution has a negative ROI relative to the labour cost invested.

The Observe-Assess-Act model operationalises this requirement. Observe execution conditions during peak trading — when gaps are visible and their revenue impact is live. Assess against the specific KPIs the observation affects: conversion rate, OSA, shrink risk, pricing accuracy. Act with full, documented resolution before the next visit.

The stores that sustain the highest financial return from field leadership are not those visited most frequently. They are those where 100 percent action completion is treated as a structural standard, not a performance aspiration.

Conclusion

The $1.8 trillion lost annually to retail execution failure is not a market problem or a technology problem. It is a leadership problem. Strategy that does not reach the shelf generates no return. Inventory that does not reach the customer generates no revenue. Training that is not reinforced in the store generates no behaviour change.

Store visits are the single most direct intervention point available to a retail operations leader — not as audits, not as compliance checks, but as a performance management system that simultaneously drives revenue through better conversion and availability, protects margin through pricing accuracy and shrink reduction, and multiplies the return on every other operational investment the business makes.

The financial gap between retailers who measure store visits by impact and those who measure them by activity runs to tens of millions of dollars per year. The data makes the case unambiguously.

The question is not whether store visits are worth the investment. The question is whether the investment is being measured in a way that captures the return.

Book a demo and find out how

Avoid wasted hours, blind spots
and lost revenue with YOOBIC

Frontline worker hero image
Categories
Retail Training

How to improve retail employee retention in a competitive market

Retail turnover rates hover between 60% and 80% annually, and replacing a single employee costs 30% to 70% of their yearly salary. For a 500-store network, that math turns into millions of dollars walking out the door every year.

Most of that turnover is preventable. This guide breaks down why retail employees quit, which strategies actually move the needle on retention, and how to measure progress across your store network.

What is retail employee retention

Retail employee retention refers to how well a company keeps its frontline store employees over time. It’s a critical metric for stability because industry turnover rates often hover between 60% and 80%, making retention a key driver of profitability and customer satisfaction. When associates stay longer, stores run more smoothly, customers get better service, and the business avoids the constant drain of recruiting and training replacements.

You’ll often hear retention rate and turnover rate used interchangeably, but they’re actually opposites. Retention rate tracks the percentage of employees who stay during a given period, while turnover rate tracks the percentage who leave. Both matter, though retention focuses your attention on what’s working rather than just what’s broken.

The state of retail turnover today

Retail turnover remains among the highest of any industry. Labor shortages, shifting worker expectations, and fierce competition for talent have made the challenge more urgent than ever. What’s particularly striking is that many employees who leave retail don’t just switch employers. They leave the industry entirely.

This isn’t just an HR problem anymore. When stores can’t keep experienced associates, execution suffers, customer experience becomes inconsistent, and managers spend more time onboarding than coaching. For operations leaders, retention has become a strategic priority rather than something to delegate to a back-office function.

The true cost of retail employee turnover

Replacing a retail employee typically costs between 30% and 70% of their annual salary. That figure adds up fast when turnover hits 60% or higher across a store network.

The costs break down into several categories:

  • Recruiting and hiring: Job postings, interviewing time, background checks, and onboarding paperwork all consume resources

  • Training and ramp-up: New hires take weeks or months to perform at full capacity, and manager time gets diverted from other priorities

  • Lost productivity: Coverage gaps, mistakes from inexperienced staff, and slower task completion hurt daily operations

  • Customer experience impact: Inconsistent service, lower conversion rates, and weaker product knowledge on the floor affect sales

  • Team morale: Remaining employees absorb extra work, which often triggers more departures

By the time turnover costs surface in sales data, the opportunity to prevent them is already gone.

Why retail employees quit

Most turnover is preventable. Employees rarely leave over a single issue. Instead, they leave when several experience gaps compound over time.

Low pay and inconsistent scheduling

Compensation that doesn’t keep pace with cost of living pushes associates to look elsewhere. Unpredictable schedules make the situation worse. When employees can’t plan their lives around last-minute shift changes, stress builds quickly.

Predictable, flexible scheduling, where associates have visibility into their hours and some control over swaps, reduces this friction significantly.

Poor onboarding and lack of training

Inadequate onboarding leaves new hires feeling unprepared and unsupported. Employees who don’t receive sufficient training are among the 22% of workers who leave within 90 days — they never build confidence, never feel competent, and never connect with the team.

Disconnected communication between HQ and stores

Fragmented communication tools and lack of visibility into company updates make associates feel isolated. When important information lives in scattered emails, bulletin boards, and group texts, frontline teams miss what matters.

Centralized mobile communication changes this dynamic. Associates who feel informed also feel included.

Limited career growth and recognition

The absence of clear career paths and meaningful recognition makes employees feel undervalued. Yet many retail workers report they don’t receive regular training or know what it takes to advance.

Burned out store managers

Overwhelmed managers who spend hours each week chasing information and juggling disconnected tools cannot coach or support their teams effectively. Manager burnout multiplies frontline turnover because associates lose their primary source of guidance and recognition.

Strategies to improve retail employee retention

Each approach below connects directly to a root cause. Addressing one or two won’t move the needle. The retailers seeing real retention gains tackle several at once.

1. Fix onboarding in the first 90 days

Structured onboarding with clear milestones, buddy systems, and regular check-ins reduces early turnover dramatically. Mobile-first onboarding embedded into daily work accelerates time-to-productivity and helps new hires feel part of the team from day one.

2. Make scheduling predictable and flexible

Research analyzing 280 million shifts across 20 retail chains shows that predictable schedules and shift-swap options improve work-life balance and retention. The contrast matters: manager-controlled last-minute changes create stress, while employee self-service scheduling tools create trust.

3. Build continuous learning into daily work

Microlearning delivered via mobile increases completion rates without pulling associates off the floor. Bite-sized training in the flow of work builds skills gradually and keeps employees engaged.

4. Recognize associates in real time

Peer-to-peer recognition, manager shout-outs, and rewards programs make employees feel valued in the moment. Annual performance reviews come too late. Instant, visible recognition reinforces the behaviors you want to see.

5. Create clear career paths for frontline talent

Visible promotion criteria, skill-based advancement, and internal mobility reduce the perception that retail jobs are dead-end. A clear retail career ladder from sales floor to team lead to store manager gives associates a reason to stay and grow.

6. Run stay interviews before exit interviews

Stay interviews are proactive conversations with current employees about what keeps them engaged. The difference matters: exit interviews tell you why someone left, while stay interviews tell you what would make them stay.

7. Equip store managers to coach not just manage

Training managers in people leadership, not just task management, improves team morale. Strong leadership is one of the most effective retention levers available. When managers have time to coach, recognize, and develop their teams, turnover drops.

How store managers drive retail employee retention

The store manager is the single biggest influence on whether associates stay or leave. Gallup research attributes 70% of team engagement variance to the manager.

Managers who have time to coach, recognize, and develop their teams see lower turnover. Managers buried in admin work don’t.

Reducing manager admin burden, like chasing information across apps or manually compiling reports, frees time for people leadership. An AI-powered copilot that surfaces priorities and recommendations helps managers focus on their teams instead of their inboxes.

How onboarding and training reduce frontline turnover

Employees who receive proper onboarding and continuous development feel invested in. Training isn’t a cost center. It’s a retention lever.

Effective training programs share a few characteristics:

  • Structured onboarding: Clear learning paths for every role reduce confusion and early attrition

  • Mobile-first delivery: Training accessible on the floor, not locked in a back-office computer, fits into daily work

  • Adaptive learning: Personalized content based on role, location, and skill gaps keeps training relevant

  • Gamification and rewards: Gamification mechanics make learning sticky and encourage completion

The payoff is faster time-to-productivity and lower turnover in the critical first 90 days.

How internal communication improves retail employee engagement

Connected, informed employees are more engaged and less likely to leave. Communication is a retention lever, not just an operational tool.

Two-way feedback loops with HQ

Enabling frontline voices to reach leadership through polls, surveys, and direct channels builds trust. When associates feel heard, they’re more likely to stay.

Mobile-first recognition and peer communities

Social features, peer communities, and visible recognition in a centralized platform build belonging. Isolated store teams feel disconnected, while connected teams feel like part of something bigger.

Targeted messaging by role and location

Relevant, targeted communication reduces noise. Associates receive information that matters to them, not broadcast-all emails that get ignored.

How technology improves retail employee retention at scale

Multi-location retailers cannot execute retention programs manually across hundreds of stores. Technology scales best practices and makes consistency possible.

Capability

What it does

Retention impact

Mobile task management

Digitizes tasks, checklists, and audits

Reduces admin burden for managers and associates

AI-powered learning

Personalizes training paths and delivers adaptive content

Increases engagement and skill development

Frontline communication platform

Centralizes updates, recognition, and feedback

Builds connection and reduces isolation

Manager copilot

Surfaces prioritized recommendations from store data

Frees manager time for coaching and recognition

Platforms like YOOBIC combine these capabilities so a campaign brief at HQ becomes a completed task with photo verification on the store floor, and managers get clear daily priorities instead of raw dashboards.

How to measure retail employee retention

You can’t improve what you don’t measure. A few key metrics help you track progress and identify which stores need intervention:

Metric

What it measures

Why it matters

Turnover rate

Percentage of employees who leave over a period

Baseline measure of problem severity

Retention rate

Percentage of employees who stay over a period

Tracks improvement over time

Time to productivity

How long until new hires perform at full capacity

Measures onboarding effectiveness

Engagement and eNPS

Employee satisfaction and likelihood to recommend

Leading indicator of future turnover

Internal mobility rate

Percentage of roles filled by internal candidates

Measures career development success

Tracking by location reveals patterns. Some stores consistently retain talent while others churn through associates. The difference often comes down to manager capability and local execution of retention programs.

Turn every store into a high-retention workplace

Retention isn’t a one-time initiative. It’s the result of addressing root causes, including communication, training, recognition, and manager support, consistently across every location.

The retailers seeing the biggest gains connect these elements in one system. When a new hire’s onboarding, daily tasks, learning, and recognition all flow through the same platform, nothing falls through the cracks. When managers get clear, prioritized recommendations instead of scattered data, they have time to lead their teams.

Book a demo and find out how

Avoid wasted hours, blind spots
and lost revenue with YOOBIC

Frontline worker hero image

Frequently asked questions about retail employee retention

What is a good employee retention rate for retail?

A “good” retention rate varies by segment, but retailers that implement structured onboarding, continuous training, and strong communication typically see retention rates well above the industry average of 35% to 45%.

What are the 5 C’s of employee retention?

What are the 3 R’s of employee retention?

Which retail positions experience the highest turnover?

How long does it take to see improvements in retail employee retention?

Categories
Operations Retail

Top 10 retail operations software for frontline teams (2026)

Running multi-location retail operations means managing thousands of tasks, communications, and training initiatives across dozens, or even hundreds, of stores, every single day. The gap between what headquarters plans and what actually happens on the store floor is where revenue gets lost, brand standards slip, and frontline teams disengage.

Retail operations software exists to close that gap. These platforms help retailers coordinate store execution, communicate with frontline workers, manage compliance and audits, and deliver training — all from a single digital hub that replaces the patchwork of email chains, WhatsApp groups, printed binders, and spreadsheets that still dominate most store operations.

But “retail operations software” is a broad category, and not every platform solves the same problem. Some focus on task management and merchandising execution. Others lead with workforce scheduling or employee engagement. And the right choice depends on your organization’s size, industry segment, and the specific operational challenges you’re trying to solve.

To help you navigate the landscape, we’ve evaluated the leading platforms based on feature depth, G2 ratings and verified user reviews, customer base, and real-world applicability for frontline retail teams.

YOOBIC logo terracotta

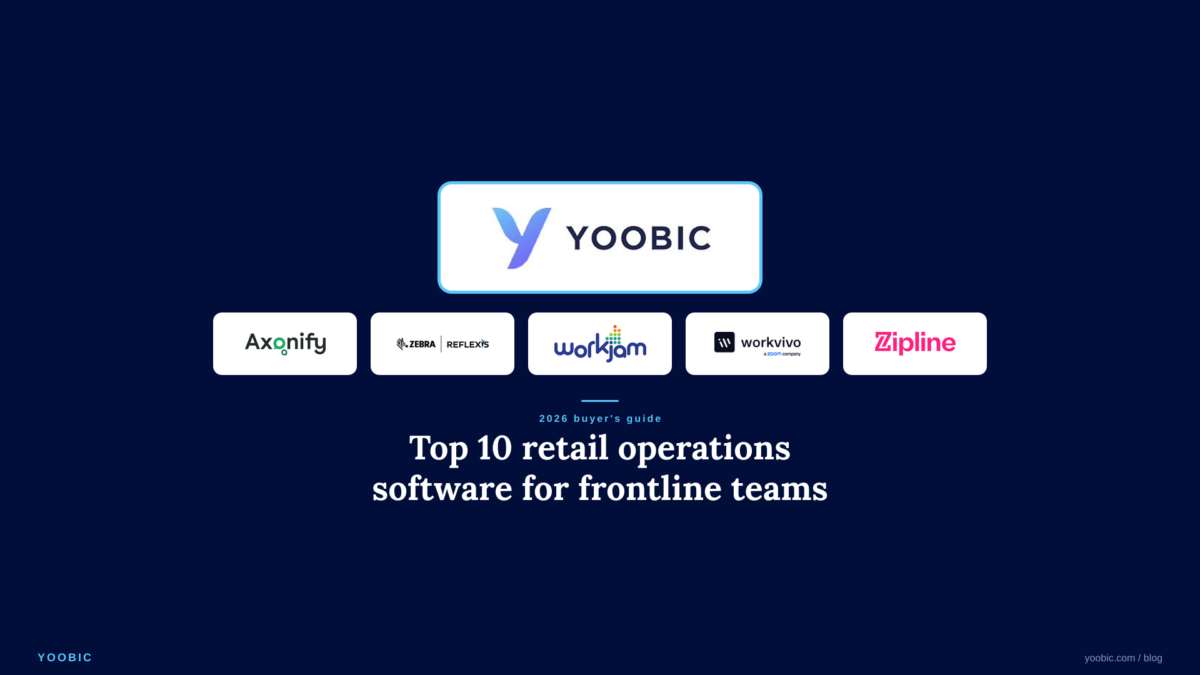
1. YOOBIC: Best overall retail operations platform

YOOBIC is the retail operations platform built for frontline intelligence and execution. It’s the only platform in the category that integrates your data, delivers role-specific intelligence, and equips every person across the organization, from HQ to store associate, with a purpose-built layer to act on it through tasks, communications, and learning.

While other retail operations platforms focus primarily on execution tools, YOOBIC makes sure every action is driven by intelligence. By combining data, AI-driven insights, and frontline execution in one platform, YOOBIC closes the gap between knowing and doing, so every team makes faster, smarter, and more aligned decisions at scale.

Industry and analyst recognition

G2: YOOBIC holds the #1 position in both the Retail Execution and Retail Task Management Grid® Reports, appearing across 142 reports and earning 27 badges.

Gartner: Named in six 2025 Gartner® Hype Cycle™ reports, including Frontline Worker Technologies, Workforce Transformation, HR Technology, and Corporate Learning Technologies. This is the third consecutive year YOOBIC has received multi-category Gartner recognition.

RETHINK Retail: Included in the 2025 “AI in the Everyday Store” report.

Across G2, Gartner, and independent retail analyst coverage, YOOBIC’s position in the category is consistently validated by sources outside the company.

What makes YOOBIC different?

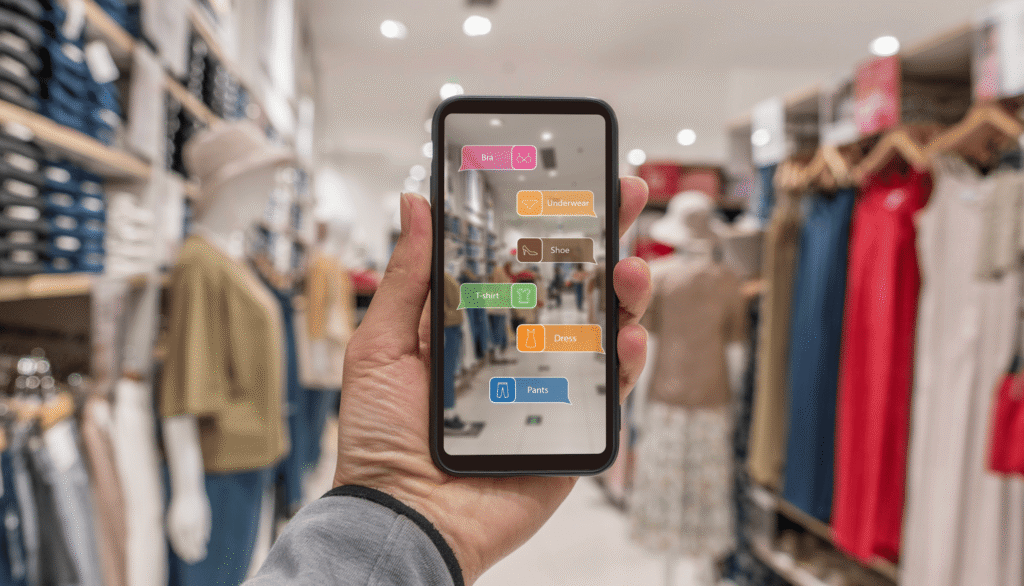
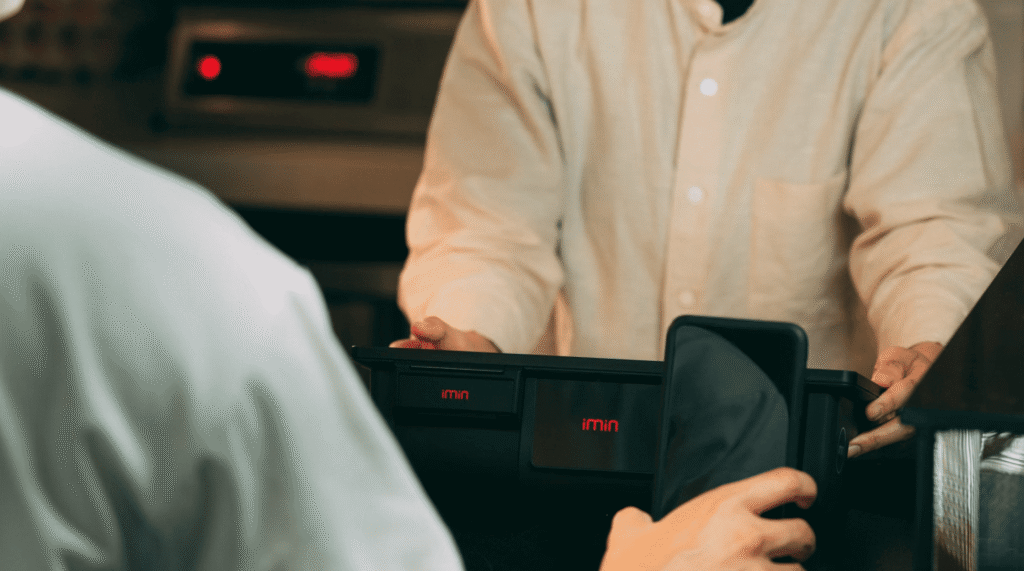
YOOBIC’s task management engine enables headquarters teams to create, assign, and monitor tasks across every store in real time. AI-powered image recognition and photo-based verification ensure merchandising displays, promotional setups, and compliance checks are completed to standard — not just marked as done. Every task generates data, giving operations leaders clear visibility into completion rates, compliance scores, and performance trends. According to Deloitte, 82% of frontline workers say better technology would directly improve their productivity, making the shift from manual task coordination to structured digital management a measurable operational lever.

In late 2025, YOOBIC acquired Humanitics, a pioneer in AI-driven retail analytics, and launched Store Manager Copilot. Copilot combines store data like sales, stock, and traffic with YOOBIC operational activity and external signals such as weather or local events. YOOBIC’s AI analyzes that information to identify patterns, benchmark similar stores, and surface opportunities to improve performance across labor, sales, and customer satisfaction. Copilot then turns those insights into clear recommendations and editable action plans inside YOOBIC, so store managers move faster from insight to action.

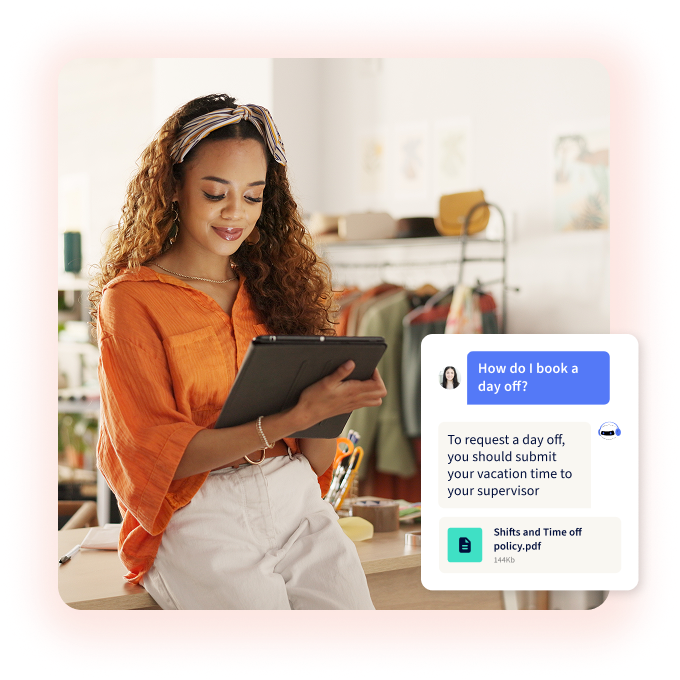
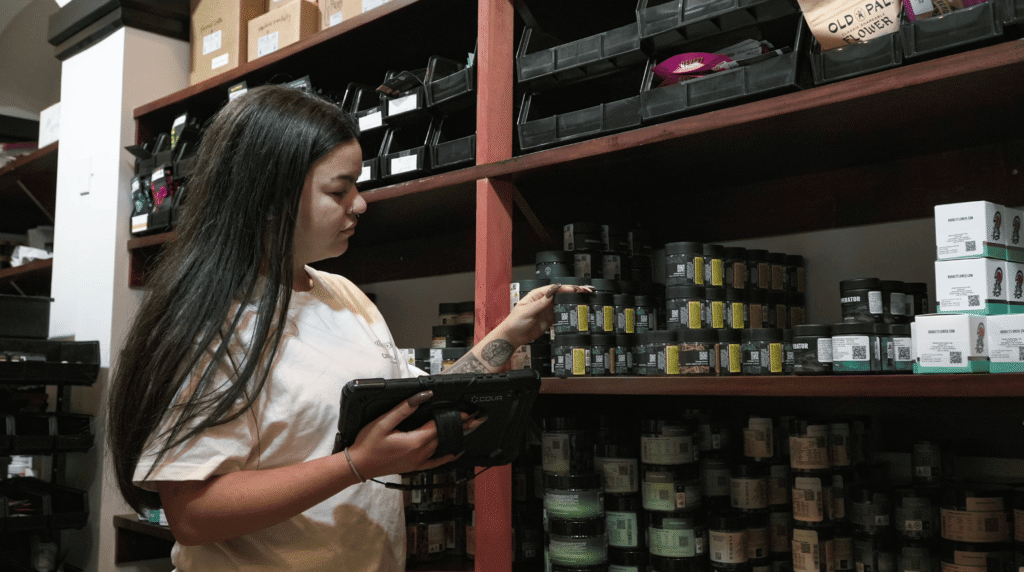
YOOBIC’s mobile-first communication hub delivers targeted updates and operational directives directly to associates with read receipts and engagement tracking. Its built-in learning module delivers bite-sized, gamified training within the same app, associates receive a task, access relevant training content, and execute with photo verification. Headquarters tracks the entire chain in one place.

Who Uses YOOBIC

YOOBIC is trusted by over 350 global brands across retail, hospitality, and QSR — including Boots, Lidl, Lacoste, Puma, Michaels, Pret, Mattress Firm, GameStop, Vans, Morrisons, Bang & Olufsen, Moschino, Longchamp, Lagardère Travel Retail, and Africa’s largest retailer, Shoprite Group. The platform supports 21+ languages and is backed by Insight Partners, Felix Capital, and Highland Europe, with offices in New York, London, Paris, and Tel Aviv.

G2 reviewers consistently highlight YOOBIC’s ease of use, fast implementation, and customer support quality. A Morrisons reviewer described the platform as delivering “a simple input creating a rich output of data” with a “smooth implementation phase handled professionally and at a fast pace.”

Best for: Multi-location retailers that need a unified, AI-powered retail operations platform for task execution, communications, and training, backed by the strongest analyst recognition and customer validation in the category.

Axonify logo

2. Axonify

Axonify is a frontline enablement solution that integrates microlearning, communication, and task management. The platform uses personalized, bite-sized learning with daily reinforcement, gamification, and adaptive learning paths. Customers include Walmart, Kroger, and Lowe’s.

Axonify’s core thesis is that consistent execution depends on frontline workers retaining and applying knowledge. The platform leads with learning science rather than operational task management, making it distinctive in how it connects training to on-the-floor execution.

Considerations: Axonify’s strength is learning-first. Organizations whose primary gap is task execution, visual merchandising compliance, or store audit workflows may find the platform less comprehensive in those areas. The platform is designed for large enterprises with distributed workforces and may not be as accessible for mid-market retailers.

Reflexis Logo

3. Reflexis (Zebra Technologies)

Reflexis, now part of Zebra Technologies following a 2020 acquisition, provides AI-powered workforce management, task management, and communication solutions. The Reflexis ONE platform covers workforce scheduling, time and attendance, task management, analytics, and reporting. Customers include Burlington, McDonald’s, Vera Bradley, and Morrisons.

Reflexis is the legacy incumbent in this space, with roots going back to 2001. The platform’s primary differentiation is its workforce management engine, covering AI-driven demand forecasting, labor budgeting, and automated scheduling, with task execution layered on top.

Considerations: G2 reviewers describe the platform as feature-rich but note a steep learning curve and limited user-friendliness compared to more modern, mobile-first alternatives. The platform’s mobile experience and frontline UX reflect its desktop-era origins. Organizations seeking a training or communications-first solution may find Reflexis weighted too heavily toward workforce management.

Zipline logo

4. Zipline

Zipline is an operations platform designed for retail chains to coordinate store tasks and communication. The platform integrates frontline communication, task management, and learning resources into a single interface. Customers include Sephora, Bath & Body Works, 7-Eleven, and AEO, Inc.

Zipline’s primary strength is HQ-to-store communication, ensuring that operational directives reach store teams with clarity and that headquarters has visibility into message readership and task completion. The platform focuses on connecting central teams with store-level execution through targeted messaging and task tracking.

Considerations: Zipline focuses more on store task coordination than on detailed field merchandising workflows or visual compliance verification. The platform does not offer the same depth of built-in microlearning or AI powered intelligence for store teams.

G2 reviewers have noted that Zipline can feel overwhelming when a large volume of information comes in at once, and some users report slow loading or refresh times.

5. WorkJam

WorkJam positions itself as the “digital frontline workplace,” combining task management, scheduling, learning, and communication. The platform integrates with existing WFM, HRIS, and LMS systems and emphasizes employee self-service features like shift swapping and open shift marketplace. Customers include Shell, Ulta Beauty, Kroger, Starbucks, and TJX.

WorkJam’s differentiator is its focus on employee empowerment, giving hourly and shift-based workers more control over their schedules, communication, and development through a single mobile app.

Considerations: WorkJam’s breadth spanning scheduling, tasking, learning, and communications means it covers significant ground, but it may not match the depth of purpose-built retail execution or merchandising tools in any single area. The platform’s primary orientation is workforce self-service rather than HQ-driven store execution, which may not align with retailers whose core need is operational control and compliance. Users have reported SSO issues, slow loading times during peak usage, and complexity during initial setup. G2 review volume is relatively modest at 57 reviews.

6. Workvivo (by Zoom)

Workvivo, acquired by Zoom in 2023, is an employee experience platform that unifies internal communications, engagement, intranet, and employee listening. The platform features a social-media-style interface for company news, peer recognition, livestreaming, and surveys. Customers include Amazon, Ryanair, Bupa, Delta, Verizon, and Lululemon.

Workvivo has significant scale and momentum, benefiting from Zoom’s enterprise distribution. The platform was named a Leader in the Forrester Wave for Intranet Platforms in 2026 and ranks #1 on G2 across multiple employee engagement and intranet categories.

Considerations: Workvivo is fundamentally an employee engagement and communications platform — not a retail execution or task management tool. It does not currently offer the store audit workflows, visual merchandising compliance, or operational task management capabilities required for frontline retail operations. The company’s roadmap includes task and shift management, but these features are still in development. G2 reviewers have noted slow loading issues, overwhelming notifications, and performance problems on mobile devices — a significant limitation for frontline teams who rely exclusively on mobile access.

Opterus logo

7. Opterus (OpsCenter)

Opterus is a Canadian retail technology company offering OpsCenter, a cloud-based platform for store communications, task management, audits, surveys, document management, and dashboards. The company was founded in 2006 and serves 65 clients across 49 countries in 26 languages. Customers include Dollar Tree, Family Dollar, Pet Supplies Plus, GNC, and Southeastern Grocers.

Opterus differentiates on its all-inclusive licensing model — all 12 modules are available at a single price with no per-module upsells.

Considerations: Opterus has a relatively small customer base of 65 clients compared to competitors with hundreds. The platform’s G2 review presence is limited, making independent validation of claims more difficult. While Opterus has recently added AI capabilities and a learning management module, these are newer additions and less mature than offerings from platforms where training and AI have been core to the product from the start.

quorso logo

8. Quorso

Quorso is a London-based platform (founded 2016, $40.9M raised from Summit Partners and OMERS Ventures) that takes a fundamentally different approach to retail operations. Rather than task management or communications, Quorso connects to a retailer’s existing data feeds — sales, waste, labor, loss, CSAT — and transforms that data into personalized, prioritized “Missions” for every store and field manager.

Quorso recently expanded its Circle K partnership and Dollar General is also a customer.

Considerations: Quorso is not a store execution, communications, or training platform — it’s a data intelligence layer. Retailers using Quorso still need a separate platform for task management, frontline communications, and training delivery. The platform’s G2 review presence is nascent, and while the “Missions” concept is distinctive, it represents a different category of tool than the unified operations platforms that make up most of this list. With only around 60 employees as of 2026, the company’s ability to support large-scale enterprise deployments alongside its rapid growth warrants consideration.

Best for: Large retailers with mature data infrastructure that want an AI-driven intelligence layer to prioritize store-level actions based on performance data.

9. Connecteam

Connecteam is a mobile-first workforce management app offering scheduling, time tracking, task management, communication, HR processes, and training. The platform is designed for deskless teams across industries, including retail, restaurants, cleaning, healthcare, and field services. 

Considerations: Connecteam is overwhelmingly used by small businesses (83% of its G2 user base) and is not designed for enterprise retail operations. The platform lacks retail-specific features like visual merchandising compliance, planogram verification, or store audit workflows. G2 reviewers have noted issues with pricing structure at scale, limited advanced features, occasional app lag, and a need for more customization. Organizations that outgrow Connecteam’s capabilities typically migrate to purpose-built retail operations platforms.

10. Repsly

Repsly is built for CPG field teams and retail service organizations focused on merchandising execution, field sales, and promotion compliance at third-party retail locations. The platform offers AI-powered image recognition for automatic shelf compliance verification, route optimization, store visit tracking, and order capture.

Considerations: Repsly serves a fundamentally different use case than the other platforms on this list. It is designed for CPG brands sending field reps into retail partners’ stores — not for retailers managing operations within their own locations. Organizations seeking to manage their own store teams’ daily execution, communications, and training will need a different category of solution. Repsly does not offer frontline communications, microlearning, or the HQ-to-store coordination capabilities found in store execution platforms.

How to choose the right retail operations software

Selecting a retail operations platform is a decision that will shape how your frontline teams work every day — across every store, every shift, and every season. The wrong choice means fragmented workflows, low adoption, and the same execution gaps you set out to solve. Here’s a framework for evaluating your options.

Start with the execution gap, not the feature list

Before comparing platforms, define the specific operational problem you’re solving. The most common mistake in this category is buying a tool that’s strong in one area while leaving other critical gaps unaddressed — which leads to tool sprawl, with separate apps for tasks, communications, and training that frontline teams resist adopting.

Ask your operations leaders where execution breaks down most frequently. Is it that store teams don’t know what to do (a training and communication problem)? That they know but don’t do it consistently (a task management and accountability problem)? Or that headquarters can’t see what’s happening on the floor (a visibility and analytics problem)? Most retailers face a combination of all three, which is why unified platforms tend to outperform point solutions.

Evaluate mobile-first design for frontline reality

Frontline retail workers don’t sit at desks. They’re on the floor, in the stockroom, and between customers. Any platform that was originally designed for desktop use and later adapted for mobile will carry that legacy in its UX — and adoption will suffer. Evaluate each platform on how it actually feels in a store associate’s hand, not just how it looks in a demo.

Key questions to ask during evaluation: Does the app work offline or in areas with poor connectivity? Can associates complete their tasks, access training, and read communications from a single mobile experience without switching apps? How quickly can a new hire start using it without formal training? The platforms with the highest frontline adoption rates are consistently the ones designed mobile-first from the ground up.

Consider the total cost of platform fragmentation

Many organizations end up with separate tools for task management, internal communications, and training — each with its own login, its own admin overhead, and its own data silo. The operational cost of this fragmentation goes beyond subscription fees. It shows up in lower adoption rates, slower rollouts, incomplete data, and the inability to connect execution quality to training effectiveness or communication reach.

When evaluating platforms, calculate the fully loaded cost: not just the license fee, but the IT overhead of managing multiple integrations, the training time for each tool, and the operational blind spots created when task data, communication metrics, and learning analytics live in separate systems.

Prioritize AI that helps managers act, not just report

AI is now a standard claim across this category, but the depth varies enormously. Some platforms use “AI” to mean basic automation or chatbot functionality. Others are embedding predictive analytics and natural-language copilots that tell store managers what to focus on today based on their store’s actual performance data.

The meaningful question isn’t whether a platform has AI — it’s whether the AI changes what a store manager does on a Monday morning. Does it surface the three actions that will have the most impact this week? Does it connect execution data to sales outcomes? Or does it simply automate tasks that could be handled with a well-designed template?

Plan for scale from day one

A platform that works well across 20 pilot stores may break down at 200 or 2,000. Ask about the largest deployments each vendor supports. Ask for references from customers at your scale — or larger. Verify that the platform supports your geographic footprint, language requirements, and organizational hierarchy without custom development.

The platforms on this list vary significantly in their proven scale. Some serve hundreds of thousands of locations across dozens of countries. Others are best suited for single-country deployments or smaller store networks. Match the platform’s proven track record to your current size and your growth trajectory.

Look beyond the feature checklist

Every vendor in this space can produce a feature comparison matrix that makes their platform look competitive. The real differentiators emerge in implementation quality, customer support responsiveness, and the vendor’s roadmap alignment with your industry’s trajectory.

Ask to speak with customers in your vertical — not just the references the vendor hand-picks, but users you find independently on G2, Capterra, or through your industry network. Pay attention to what reviewers say about support quality, implementation speed, and whether the platform delivers measurable results, not just operational digitization.

The retailers seeing the strongest outcomes from these platforms are the ones that chose a partner, not just a product — and that unified their frontline execution, communications, and training into a single experience their teams actually use.

Why YOOBIC is the best choice for most retailers

“Working with YOOBIC as a partner has been one of the best experiences. I don’t think I’ve heard a ‘no’ yet… every step of the way we’ve had somebody that’s been an expert and has been there to help us do exactly what we need to do”

Tiffany Reese, Director of Workload & Communications, Michaels

YOOBIC is the only retail operations platform on this list that checks every box in the evaluation framework above. It’s a unified platform, not a point solution, that eliminates fragmentation by combining task execution, communications, and frontline training in a single mobile-first app. Its AI goes beyond automation: Store Manager Copilot delivers prioritized, data-driven actions in natural language, not just dashboards to interpret. 

With 350+ global brands across 21+ languages, YOOBIC has proven scale to handle the largest retail chains. And its three consecutive years of Gartner Hype Cycle recognition and #1 G2 rankings across Retail Execution and Retail Task Management provide the independent validation that separates category leaders from contenders.

For multi-location retailers looking to close the gap between headquarters strategy and store-floor execution, YOOBIC delivers the most complete, most validated, and most AI-advanced solution in the market.

YOOBIC is the leading AI-powered retail operations platform, trusted by 350+ global brands. Request a demo to see how YOOBIC can transform your frontline operations.

Book a demo and find out how

Avoid wasted hours, blind spots
and lost revenue with YOOBIC

Frontline worker hero image
Categories
Operations Retail

The complete guide to retail store walks in 2026

Most retailers conduct store walks regularly. Fewer get consistent results from them. The difference is almost never the checklist. It is the system that surrounds the walk: the preparation before, the scoring during, and the follow-through after. This guide covers everything you need to run store walks that actually drive execution.

What is a retail store walk?

A retail store walk is the systematic evaluation of a store’s operational, commercial, and compliance condition, conducted by a store manager or area manager. It is not a casual walkabout. It is a structured diagnostic process designed to identify whether the store is performing to standard, and to surface issues before they affect customers or revenue.

The primary objective is to see the store through the customer’s lens while measuring it against corporate standards. When done well, store walks shift the organization from anecdotal observation to quantifiable data, making it possible to distinguish a localized management problem from a systemic process failure.

Why store walks matter more than most retailers realize

Store walks are the primary mechanism through which corporate strategy reaches the sales floor. Every planogram decision, promotional directive, and brand standard lives or dies based on what happens during those visits. Yet in most retail organizations, the walk is treated as a compliance activity rather than a performance driver.

The research is clear on the commercial stakes. According to the University of Chicago’s Becker Friedman Institute, individual managers account for 25% to 35% of the variance in store-level productivity. Replacing a bottom-10% manager with a top-10% manager increases store productivity by 50% to 100%, which is functionally equivalent to adding a full-time employee without increasing headcount.

The cost of poor execution extends well beyond individual stores. Research from Coresight and Simbe found that in-store inefficiencies cost retailers 4.5% of total revenue annually, representing a $127.9 billion global opportunity. Bain and Company found that operational excellence drives a 10 to 15 percentage point improvement in customer NPS.

These figures do not describe abstract risks. They reflect the direct financial impact of store walks that fail to drive follow-through. The walk is the opportunity. Execution is the outcome.

Warehouse stock management
Warehouse workers discussing with clipboard while working in warehouse

What are the different types of store walk?

Not all store walks serve the same purpose, and conflating different visit types is one of the most common reasons programs underperform. A compliance check and a coaching visit require different preparation, different scoring criteria, and different follow-up actions. Leading retailers keep them distinct.

Operational walks

These evaluate the day-to-day hygiene of the business: cleanliness, lighting, equipment function, backroom organization. The strategic outcome is efficiency and overhead reduction. Operational walks are the baseline; everything else builds on them.

Visual and commercial walks

These verify planogram execution, promotional displays, pricing accuracy, and signage. The strategic outcome is revenue growth and brand consistency. In fashion retail, this visit type runs on a weekly cycle and focuses heavily on fitting room condition, which is a critical conversion touchpoint.

Loss prevention and safety walks

These identify theft risks, check fire exit accessibility, and verify food safety compliance. In grocery retail, BRC Issue 9 standards now require auditors to go beyond temperature log checks and assess employees’ genuine commitment to hygiene through direct conversation. In convenience formats, safety walks prioritize security cameras, panic buttons, and exterior lighting because these locations often operate with solo staff.

Leadership and coaching visits

These focus on the human dimension: staff engagement, skill gaps, morale, and best practice sharing. The strategic outcome is retention and service quality. This visit type tends to have the highest long-term impact on store performance, yet it is often the first to be deprioritized when area managers are under time pressure.

Walk typePrimary focusStrategic outcome
OperationalCleanliness, equipment, backroomEfficiency and overhead reduction
Visual/commercialPlanograms, pricing, promotionsRevenue growth and brand consistency
Loss prevention/safetyShrink, security, complianceMargin protection and legal risk mitigation
Leadership/coachingStaff engagement, best practicesRetention and service quality
Retail inventory tablet
Clothing Store: Male Visual Merchandising Professional Uses Tablet Computer To Create Collection. Fashionable Shop Sales Retail Manager Checks Stock. Small Business Owner Orders Stylish Items

Who runs store walks, and how often?

The effectiveness of a store walk depends as much on who conducts it and when as on what the checklist contains. High-performing retailers use a layered approach where daily checks by store managers are reinforced by structured weekly visits from area managers and periodic deep-dives from regional directors.

Store managers: daily cadence

At the unit level, store managers conduct opening and closing walks that are tactical and binary. These confirm the store is trade-ready: lights, HVAC, cash drawers, overnight issues resolved before the first customer arrives. The morning walk is the final check before the day begins, not a performance evaluation.

Area managers: weekly strategic visits

Area managers typically manage a portfolio of stores and conduct four to six visits per week. These visits are more analytical than the daily store manager walk. They connect footfall and revenue data to the physical state of the floor, identifying whether performance gaps are operational, commercial, or people-related. The area manager’s role is to act as a knowledge facilitator: taking a successful merchandising approach from one location and replicating it across the district.

Regional directors: periodic deep-dives

Regional directors conduct less frequent but more comprehensive visits, examining trend data across multiple stores. These visits diagnose systemic issues that individual area managers may not spot because they are too close to individual locations.

The most advanced programs are now moving away from fixed-calendar visit schedules entirely. By analyzing historical audit trends, task completion rates, and sales data, AI models can predict which stores are at highest risk of operational slippage and direct area manager time accordingly. This shifts the model from scheduled activity to impact-based prioritization.

How to run an effective store walk: a step-by-step process

An effective store walk follows five stages: preparation, pathing, objective scoring, coaching, and closure. Each stage depends on the previous one. Arriving without preparation, or closing without capturing actions, turns the walk into an observation exercise with no operational outcome.

Step 1: Prepare before you arrive

Effective store walks begin before the auditor enters the building. Review the store’s last three audit scores, task completion rates, and customer feedback before arriving. This context tells you where to focus. If a store has consistently failed on promotional execution for two months, you already know where to spend your time. You are not discovering problems; you are diagnosing their root cause.

Pre-visit preparation also changes the dynamic with the store team. Walking in with data signals that the visit is purposeful, not procedural.

Step 2: Path the store as a customer would

Auditors in North American and European markets typically move counter-clockwise through the store, mirroring the natural customer journey. This approach surfaces issues in the sequence a shopper would encounter them, starting with the transition zone between the entrance and the first displays, where customers adjust to the environment.

Pathing the store this way ensures the audit captures the customer experience, not just the operational checklist.

Step 3: Score objectively across five zones

Subjective impressions produce inconsistent results. Leading retailers use weighted scoring: critical safety items carry significantly higher point values than minor organizational issues. Binary Yes/No criteria, such as ‘Does the planogram match the reference photo?’, produce scores that are consistent regardless of who conducts the walk.

The five zones to evaluate on every store walk are:

  • Exterior and entry: curb appeal, window cleanliness, lit signage
  • Visual merchandising: endcap and power wing execution, planogram compliance
  • Pricing and labels: shelf price matching the digital record across all SKUs
  • Staff and customer experience: greeting speed, product knowledge, floor presence
  • Backroom and safety: stock organization, fire exit accessibility, security systems

Digital audit platforms strengthen this stage by providing visual benchmarks within the checklist. When an auditor can see a reference photo of a correctly executed display alongside the current state, subjectivity is removed and regional drift in standards is eliminated.

Step 4: Coach in the moment

Findings should be communicated to the store team during the visit, not delivered as a written report days later. Coaching during the walk gives store managers the context to understand why something matters, not just that it needs fixing. It also prevents the visit from feeling like an inspection rather than a support call.

This approach aligns with modern frontline training strategies like microlearning and gamified learning that reinforce behaviors in real time.

Step 5: Capture and assign every action before you leave

Every failed item must leave the visit as an assigned task with a named owner, a deadline, and a photo verification requirement for closure. This is the step most programs skip or do inadequately. Section 7 covers this in detail.

Boutique employee
Portrait Of Female Owner Of Fashion Store Using Digital Tablet To Check Stock In Clothing Store

Retail store walk checklist

High-performing retail audit programs use weighted scoring and binary criteria. When auditors face 300-item checklists, they resort to checking boxes without verifying. Focus your checklist on high-impact items and weight safety-critical checks accordingly.

The checklist below is organized by the five observation zones from Section 5. Each item uses binary criteria: it either meets standard or it does not. Adapt the item weighting by segment based on your operational priorities.

Zone 1: Exterior and entry

  • Exterior signage is lit and undamaged
  • Windows are clean and display is trade-ready
  • Entrance is clear and unobstructed
  • Store hours are correctly posted and visible
  • Transition zone is clear and first impression is on standard

Zone 2: Visual merchandising and displays

  • Endcaps are built to planogram with correct SKUs
  • Power wings match current promotional directive
  • Window display reflects current campaign, not prior period
  • Mannequins/fixtures are correctly styled and fully stocked
  • Seasonal or promotional zones are correctly executed
  • Stock is pulled forward across all shelving

Zone 3: Pricing and promotional execution

  • Shelf prices match POS/digital record on sampled SKUs
  • Promotional signage is in correct location and date-accurate
  • No expired promotions are displayed
  • Price tickets are present on all displayed products
  • Markdown items are correctly signed and priced

Zone 4: Staff and customer experience

  • All scheduled staff are on floor and correctly uniformed
  • Staff acknowledged customers within a defined number of seconds
  • Staff demonstrated adequate product knowledge when tested
  • Till areas are appropriately staffed for current footfall
  • Fitting rooms are clean and meet the defined item limit standard (apparel)

Zone 5: Backroom, safety, and compliance

  • Fire exits are unobstructed and correctly signed
  • Emergency signage and equipment are present and accessible
  • Backroom stock is organized and correctly labeled
  • Security systems are operational (cameras, alarms, panic buttons)
  • HACCP logs are current and correctly completed (food retail)
  • Health and safety signage is current and correctly displayed

What happens after a store walk?

The transition from finding a problem to solving it is where most store walk programs fail. Completing the walk is not the same as driving improvement. The follow-up process determines whether a visit has any commercial impact.

The majority of store walk guides stop at the checklist. This is where execution actually begins.

When issues are identified but not assigned to a specific owner with a deadline, they remain unresolved. Research confirms the pattern: without clear accountability, the same failures resurface in every audit for months. A broken light, a missing SKU, a planogram deviation: these are not new problems. They are old problems that were never properly closed.

Step 1: Convert every failed item into an assigned task

Every issue identified during the walk must leave as a task assigned to a named individual, with a specific completion deadline. Generic action plans sent to ‘the store team’ are not accountability. Named ownership is.

Step 2: Require photo verification for closure

Photo verification is the most effective closure mechanism because it requires physical proof, not self-reporting. A task is not complete until the photo confirms it. This removes ambiguity and creates a clear record.

Step 3: Review completion before the next visit

Outstanding actions from the previous visit should be the first item reviewed on the next store walk. This creates continuity between visits and signals to store teams that nothing falls through the gap between visits.

Step 4: Use recurring failures to diagnose systemic issues

If the same items fail across multiple audits or multiple stores, that is not a store-level compliance problem. It is a process, training, or communication failure at the organizational level. Pattern recognition across visits turns individual audit data into strategic insight.

MetricManual/paper processDigital platform
Reporting lag3+ days after visitReal-time
Admin time (area manager)10+ hours per weekUnder 2 hours per week
Compliance consistency40-60%70%+
Visibility into out-of-stock45%90%+ (with AI/vision)

In manual systems, reports are often reviewed three or more days after the visit. By the time a regional manager sees a failure in promotional execution, the promotion may already be past its window for correction. Delayed reporting does not just slow things down; it renders the data useless.

Book a demo and find out how

Avoid wasted hours, blind spots
and lost revenue with YOOBIC

Frontline worker hero image

Why store walk programs fail

Store walk programs fail for four structural reasons: checklist overload, delayed reporting, no accountability for actions, and visit cultures that punish rather than support. These are design problems, not effort problems. The checklist is rarely the issue.

Failure 1: Checklist overload

When headquarters adds questions to the audit over time, checklists grow until they are unmanageable. When auditors face a 300-item checklist, the most common response is to check boxes without verifying, a practice known as pencil-whipping. High-impact areas get the same attention as irrelevant ones, and the walk loses its diagnostic value entirely.

The fix: prioritize. Focus the checklist on high-impact items, weight safety-critical checks, and remove anything that does not directly affect customer experience or brand standards compliance.

Many retailers pair simplified checklists with mobile-first training to ensure teams understand not just what to do, but why it matters.

Failure 2: Data without action

In paper-based or spreadsheet-driven systems, visit reports are often reviewed days after the walk. By then, a promotional execution failure is past its correction window. Delayed reporting turns real-time observations into historical records that nobody acts on.

The fix: use digital platforms that generate reports and tasks in real time, not after a manual compilation process.

Failure 3: Operational drag

Brightpearl research found that manual administrative tasks consume 332 hours per manager annually. Time spent compiling reports, formatting data, and chasing updates is time not spent on the floor coaching store teams. The administrative burden does not just slow down reporting; it reduces the quality of every visit that precedes it.

The fix: automate data capture and report generation so area manager time is spent on observation and coaching, not administration.

Failure 4: No accountability

Issues identified during a walk but not assigned to a named owner simply do not get resolved. Without clear ownership, the same items fail audit after audit. This is the most damaging failure mode because it erodes confidence in the entire program.

The fix: every failed item becomes a named task with a deadline and a photo verification requirement. No exceptions.

Failure 5: The visit as a police action

When store teams experience visits as inspections designed to catch problems rather than support performance, they respond accordingly. Issues get hidden rather than surfaced, workarounds are dressed up for the visit, and the audit data becomes a reflection of what teams have learned to show rather than what is actually happening.

The fix: change the tone and structure of visits so that surfacing a problem is rewarded, not penalized. Section 9 covers this in detail.

Coaching-led vs compliance-led store walks: what the best field leaders do differently

The question most area managers should ask is not ‘how do I complete more store walks?’ but ‘what am I actually doing during those visits?’ The structure of the visit determines whether it drives performance or just generates paperwork.

Research from the Becker Friedman Institute confirms that managers account for 25% to 35% of store-level productivity variance, and that top-10% managers drive 50% to 100% higher productivity than bottom-10% managers. That gap is not explained by the number of visits. It is explained by how those managers use their time during visits.

Compliance-led visitCoaching-led visit
Begins with the checklistBegins with data from the last visit
Scores every item in sequenceFocuses time on recurring failure points
Communicates findings in a written reportCoaches in the moment during the walk
Treats all failures as equalDistinguishes systemic issues from one-offs
Leaves with a completed formLeaves with named actions and an agreed plan
Store team prepares for the visitStore team surfaces issues proactively

The most effective area managers use store walks to align labor to demand. They ensure that peak traffic periods are spent on customer engagement and selling activity, not administrative tasks or stock replenishment that could happen during quieter hours. This is a commercial decision, not just an operational one.

The best field leaders also use visits to transfer knowledge across their district. A successful merchandising approach in one store gets shared deliberately rather than accidentally. This is what the area manager role is for: not policing standards, but accelerating the spread of what works.

When store teams believe that surfacing a problem will result in support rather than scrutiny, they surface more problems. Accurate audit data is a product of trust, not inspection frequency.

In-store AR shopping
Augmented reality marketing . Hand holding smart phone use AR application to check information in a large clothing shop

How technology is changing store walks in 2026

The structure of an effective store walk has not changed fundamentally. Preparation, pathing, objective scoring, coaching, and follow-through are still the disciplines that drive results. What technology changes is the speed, consistency, and reach with which those disciplines can be applied.

Digital audit platforms replace paper and spreadsheets

Platforms that bring HQ, field teams, and store managers onto a single communication channel reduce area manager admin time from 10 or more hours per week to under two hours. Findings are captured on a mobile device during the walk. Tasks are generated automatically from failed checklist items. Reports are available in real time, not three days later.

AI and computer vision automate routine verification

AI-powered sensors and camera systems can now audit displays in real time, detecting missing SKUs and planogram deviations before a human auditor enters the store. This shifts the area manager’s role from verification to analysis. Instead of confirming what is wrong, they can focus on understanding why it is wrong and what needs to change.

Predictive analytics shifts from calendar to impact

By analyzing historical audit trends, task completion rates, and sales data, AI models can predict which stores are at risk of operational slippage. This enables area managers to prioritize their visit schedule based on commercial impact rather than a fixed rotation. Time goes to the stores where it will have the most effect.

Automation extends the execution layer beyond the visit

Robotic Process Automation now handles routine triggers at the execution level: automatically generating a purchase order when stock falls below threshold during a walk, or raising a maintenance ticket when equipment is flagged as broken. This creates a feedback loop where the store walk initiates a series of downstream actions without requiring manual intervention at every step.

The practical effect of these changes is that store walks become more targeted and more accountable. The technology does not replace the judgment of a good area manager. It removes the administrative friction that prevents that judgment from being applied where it matters.

See for yourself

Let us show you how YOOBIC can level up your operations

Illustration of a manager and employee interacting through the YOOBIC app

Frequently asked questions

What is a store walk?

A store walk is a structured evaluation of a retail store’s operations, merchandising, compliance, and overall customer experience. It is typically conducted by store managers, district managers, or regional leaders to assess whether the store is meeting company standards. Unlike a casual walkthrough, it follows a defined process that helps identify issues, ensure consistency, and drive performance improvements across locations.

What are the 5 R’s of retailing?

What are the 5 P’s of retail?

What is the 3 3 3 rule in sales?

What are the 7 principles of retail?

Categories
Case Study Operations Retail

How Morrisons built the foundation for intelligent store execution (RTS 2026)

Featuring Gordon Macpherson, Group Productivity Director, Morrisons | Bahareh Ghazinoori, Global VP of Account Management, YOOBIC

TL;DR

UK retailers are facing £5.6bn in additional operating costs in 2025/26. In that environment, execution that relies on paper, PDFs, and manual follow-up isn’t just inefficient — it’s a direct drag on margin.

At Retail Technology Show 2026, Morrisons and YOOBIC shared how they tackled that problem head-on: replacing fragmented, paper-based task management with a single digital execution platform across approximately 500 stores and 70,000 colleagues. Weekly task volumes fell from 80–100 items to approximately 10 targeted actions per manager, routed directly to the responsible colleague.

The result: real-time completion visibility, higher promotional participation, improved safe and legal compliance, and time savings validated by internal time-and-motion studies. And with that foundation in place, Morrisons is now building toward automated tasks and an AI-generated intelligence layer — work that would not be possible without getting the basics right first.

Why store execution is a margin issue right now

UK retailers are absorbing the largest cost increase in a generation. According to research by Retail Economics and YOOBIC, the sector faces a £5.6bn operating cost headwind in 2025/26, driven by higher employer National Insurance contributions, rising minimum wage rates, and increased business rates. Margins in food retail were already thin. They are thinner now.

In that environment, operational waste is not a background inefficiency. It is a direct threat to profitability. Every task that goes unactioned, every promotion that doesn’t land as planned, every compliance check that gets missed — each one costs money the business cannot afford to lose twice.

For a deeper breakdown of how execution gaps translate into lost revenue, read our guide to the retail execution gap.

And yet many retailers are still trying to solve that problem with paper, PDFs, and cascading instructions through store managers who have a hundred other things to manage. The gap between what head office asks and what actually gets done in stores is structural. It doesn’t close by asking harder. It closes by changing the system.

That’s the problem Morrisons set out to solve. Gordon Macpherson, Group Productivity Director at Morrisons, knows it from the inside. He’s been the regional manager who visits a store four weeks after his last trip and can’t remember what he asked the team to do. The team remembers. They’ve been waiting to find out whether the instruction still stands.

At Retail Technology Show 2026, Macpherson and Bahareh Ghazinoori, Global VP of Account Management at YOOBIC, walked through how Morrisons rebuilt its store execution model from the ground up — and why getting that foundation right was a deliberate precondition for everything that comes next.

Here’s what they did, and what it means for any retail operations leader who recognizes the same problems in their own estate.

The system that made consistent execution almost impossible

The starting point, as Macpherson described it at the session, was an operational model held together by paper, PDFs, and manual follow-up. Each week, 80 to 100 tasks went out to stores from head office. Most of them landed with the store manager, who was expected to cascade them to the relevant colleague, then remember to check whether they had been done.

In practice, that chain broke regularly. Regional teams spent time on collation calls and spreadsheets. Supplier partners visited stores and found incomplete activations. Some came back with financial reimbursements. The cost of inconsistent execution was not abstract.

“We barely got time to do things once, never mind twice or three times.”

Gordon Macpherson, Group Productivity Director, Morrisons

The impact showed up in three ways: critical tasks were missed or poorly executed, supplier and commercial relationships were strained, and management time was consumed by follow-up rather than coaching. In a tight-margin food retail environment, none of those outcomes was sustainable.

This type of fragmented communication is one of the biggest barriers to consistent execution in stores. Learn how leading retailers are solving this in our guide to frontline communications.

The real change: fewer tasks, routed to the right person

Morrisons reduced weekly task volumes from 80–100 items to approximately 10 targeted actions per manager and routed each task directly to the responsible colleague rather than through the store manager. This removed the manual cascading dependency, gave regional teams real-time completion visibility, and freed store managers to focus on exceptions rather than administration.

When tasks go directly to the colleague responsible for completing them, accountability becomes clear and the store manager is no longer the relay point for every instruction. Macpherson illustrated this with a concrete example from the session. When Morrisons changes the café menu on a Monday morning at 9am, a task now goes directly to every café manager across the estate. The store manager can see whether it has been completed. So can the regional manager and head office. If it has not been done, the store manager receives a prompt.

“Instead of spending all their time walking everything, they can prioritize now the things that they know aren’t done, because they’ve got a prompt saying, ‘Hey, I’m not done.’”

Gordon Macpherson, Group Productivity Director, Morrisons

The trended data changes the management conversation. A regional manager who previously suspected a store had a fresh area problem can now see it in two months of data and have a specific, evidence-based coaching conversation, rather than a subjective debrief.

From planning to first store in three months

Ghazinoori was direct about the deployment model at the session: rolling a platform out to 70,000 people is a change management initiative, not a technology installation. With that many end users, there is no room to get it wrong and course-correct in public.

Morrisons went from planning to live in the first store within three months. The full rollout across approximately 500 stores followed region by region over the following months. That pace was possible because the build phase was slow and deliberate.

1. Kickoff and planningAlign on the business problems to solve. Define what success looks like before anything is built.
2. Build and designDesign use cases with the frontline in mind. Map use case complexity against expected impact, prioritizing high-impact, low-complexity actions first.
3. Pilot and testingDeploy to a select cohort of stores. Gather direct feedback from colleagues on whether the use cases work in daily operations.
4. Single-region rolloutValidate at region level before scaling. Incorporate feedback. Confirm the design is right for the teams who will use it every day.
5. Scale across the estateMove fast once one region is proven. The confidence built in earlier phases makes rapid scaling achievable.

Macpherson noted the team made significant changes during the testing phase based on feedback from store colleagues. Getting it right in the office was not the standard. Getting it right for the frontline was.

Morrisons did not roll out hardware alongside the platform. YOOBIC was made available on existing store devices, tablets, and back-office systems. Most colleagues opted into using their own personal devices without being asked.

Why commercial execution came before health and safety

Use case sequencing was a deliberate strategic decision, not a phasing convenience. Ghazinoori explained how the team mapped every potential use case against two variables: complexity to build, and expected impact for store teams.

Low complexity, high impact goes first. That is where the initial momentum comes from.

Phase 1: Commercial executionPhase 2: Health, safety, and legal
•  Promo guidelines
•  In-store price changes
•  Store-specific memos•  Marketing planner
•  Replaced a fragmented doc with hundreds of links to PDFs and Google Sheets
•  Safe and legal audit
•  Temperature checks via Bluetooth probe
•  Health and safety checklists
•  Department-level task routing
•  Replaced a slow legacy tool; gave teams live compliance visibility for the first time

The temperature check integration illustrates how phase two raised the technical bar. When a colleague plugs a Bluetooth probe into food, the reading populates directly within the task. If the temperature falls outside the permitted range, the system triggers an automated alert and corrective action to the responsible manager. What previously required manual logging and reactive follow-up now happens automatically.

Starting with commercial use cases built familiarity with the platform before phase two introduced compliance-critical processes. Store teams had already experienced it working for them. That made adoption of the more demanding use cases smoother.

This sequencing mirrors how many retailers approach visual merchandising and promotional execution, where speed and consistency directly impact revenue.

What the data looks like now

YOOBIC scale: 70k active users, ~500 stores, and reduced manager actions.

Macpherson was measured about the outcomes at the session. Morrisons is not perfect, he said. But the foundation has changed.

The commercial evidence is visible. Higher promotional participation, better key deals performance, and sharper trade plan implementation have all moved in the right direction. Time savings for managers were validated through internal time-and-motion studies. Safe and legal compliance visibility has improved materially.

The outcome that tells the most instructive story is the two-way accountability loop. Before YOOBIC, head office issued instructions and waited for feedback to arrive through informal channels. Now the data surfaces immediately.

“9:00am we now know straight away there’s 300 cafés that couldn’t implement the new menu this morning. What’s the reason? The reason is 270 of them didn’t get the marketing. That’s unlikely to be a store problem.”

Gordon Macpherson, Group Productivity Director, Morrisons

In the previous system, 270 stores missing a menu change would have surfaced gradually through visits, complaints, and calls. The root cause would have been attributed to store performance by default. Real-time data makes the diagnosis accurate and immediate. That changes who the 

Connecting execution data with commercial performance is what allows retailers to move from reporting to action.

Making performance visible without making it feel like surveillance

When asked about cultural pushback at the session, Macpherson acknowledged the tension directly. Making execution data visible does create accountability that did not previously exist. There is no point pretending otherwise.

How that accountability is led determines whether the platform is received as support or oversight.

“This was implemented to be a coaching tool to help and support, not to be a big stick to beat people over the head with.”

Gordon Macpherson, Group Productivity Director, Morrisons

Ghazinoori added that the rollout framing was as important as the platform itself. The question put to store teams during piloting was not whether they could use the app, but whether it would improve their day-to-day. Their feedback was incorporated before wider deployment, not after.

Seventy thousand colleagues are active users. Most opted into using the platform on their own personal devices without being asked. That is the strongest signal of how the adoption landed.

From foundation to intelligence: what Morrisons is building next

The work Morrisons completed over the past year was never just about fixing task management. It was about building the operational foundation that makes everything else possible. Paper-based processes are gone. Point solutions have been consolidated into a single platform. Health and safety, communications, and task management now run through one system, with every action routed to the right person from the start.

That foundation matters — because without it, the next two stages of this journey aren’t available. Retailers who skipped this phase, or patched it with disconnected tools, have to go back and rebuild before they can move forward. Morrisons don’t.

Automated tasks: rules-based execution at scale

The first stage beyond foundational execution is automation — and it’s important to be precise about what that means. Automated tasks are not AI. They are logic. A human defines a rule upfront; the system executes it automatically when the condition is met.

Morrisons operates between 400 and 600 AI cameras per store. When a camera detects an empty shelf, the system automatically generates a replenishment task and routes it directly to the relevant colleague. No one is watching the feed. No one has to decide whether to act. The condition is met, the task fires, and the store team gets a clear action to complete. The human role is the response, not the monitoring.

This kind of automation removes a whole category of manual detection and delegation from store operations. It’s fast, consistent, and doesn’t depend on anyone noticing the problem first.

AI-generated tasks: intelligence, not just logic

The stage above automation is meaningfully different, and the distinction is worth being clear about because the market conflates the two constantly.

With automated tasks, a human programmed the rule. The system is doing exactly what it was told to do when a specific condition occurs. With AI-generated tasks, no human defined the rule. The AI analyses multiple data streams simultaneously — sales patterns, stock levels, camera feeds, traffic data, historical benchmarks — and surfaces a recommended action that no one anticipated in advance.

“There’s no point giving data for the sake of data. It’s about what you do with that data and how you act on it.”

Bahareh Ghazinoori, Global VP of Account Management, YOOBIC

That’s the principle the AI layer is built around. It isn’t reporting what happened. It’s telling the store team what they should probably be doing right now, based on everything the system is seeing across the estate.

The longer-term vision Macpherson described is YOOBIC as the single platform every frontline colleague goes to for everything — cameras, digital shelf labels, supply chain systems, communications, and tasks all surfaced in one place. That level of integration only works if the execution layer beneath it is solid. The foundation has to come first. Morrisons built it first. That’s what makes everything above it viable.

Before and after: how task management changed at Morrisons

DimensionBefore YOOBICAfter YOOBICBusiness impact
Task volume80–100 weekly tasks per managerApproximately 10 targeted actionsLess noise, clearer priorities
Task routingCascaded via store managerDirect to the responsible colleagueNo manual delegation dependency
Completion visibilityPhone calls, follow-up visits, collation sheetsReal-time data visible to store, regional, and HOFaster diagnosis of non-compliance
CommunicationsPDFs, printed docs, fragmented shared documentsTargeted, role-specific digital tasksRelevant information reaches the right person
Accountability directionOne-way: stores accountable to head officeTwo-way: stores and HO both visible in the dataOffice-side failures surface alongside store failures
Safe and legalManual logging, slow legacy tool, no live visibilityBluetooth probe integration, live compliance dataTime savings validated by time-and-motion study

Five takeaways from the Morrisons deployment

1.  Task volume and task routing are the structural variables. Reducing from 80–100 weekly tasks to approximately 10 targeted actions was not a reduction in rigor. It was a recognition that volume without clear routing produces inconsistency. The platform makes direct routing possible. The task design makes it real.

2.  Direct routing removes the manager cascading dependency. When tasks go to the responsible colleague, completion accountability is clear and the store manager can focus on exceptions. That changes the nature of the management role.

3.  Use case sequencing is an adoption strategy. Starting with high-impact, low-complexity commercial use cases before moving into compliance-critical processes builds frontline familiarity and trust. Phase two works because phase one was done well.

4.  Visibility creates accountability in both directions. The same data that shows a store has not completed a task also shows when head office failed to send the materials needed to complete it. Two-way visibility changes who the conversation is with.

5.  The execution foundation has to come before the intelligence layer. Automated tasks and AI-generated task generation both require a functioning execution infrastructure beneath them. Morrisons built the foundation first. That sequencing is the model.

The foundation changes what becomes possible

Four weeks after a store visit, a regional manager should be able to see exactly what they asked stores to do, who completed it, and what the quality looked like. That visibility did not exist at Morrisons two years ago. It exists now.

The session at RTS 2026 traced how that change happened: a deliberate deployment, a phased use case approach, a frontline-first rollout, and a task structure that routes work to the right person from the start.

What comes next — automated tasks triggered by AI cameras, an AI-generated intelligence layer surfacing recommended actions, a single platform connecting cameras, supply chain, and communications — is only viable because that execution foundation is in place. Morrisons did not start with AI. They started with clarity about who is responsible for what, and whether it got done. That is the right sequence.

The Morrisons session in one takeaway

Store performance improves when teams focus on fewer priorities, with clearer ownership and real visibility into what gets done. But that’s only the beginning. The retailers who invest in getting that foundation right are the ones who will have access to automation and AI that actually works — because the execution layer beneath it is solid.

Book a demo and find out how

Avoid wasted hours, blind spots
and lost revenue with YOOBIC

Frontline worker hero image
Categories
AI Operations Retail

How is AI improving store performance? What YOOBIC demonstrated at RTS 2026

TL;DR

At RTS 2026, YOOBIC showed how routing the right store data to the right person — before a decision needs to be made — closes the execution gap that most retail networks treat as unavoidable.

Hugo Boss delivered a 3.2% increase in incremental revenue directly attributable to AI recommendations. The mechanism: an average of 2.4 identifiable commercial opportunities per store, per week, that most networks leave undetected.

Why retail store data alone isn’t enough

It’s 8:45am. Two people have called in sick, the Wi-Fi is down, and the morning briefing starts in 15 minutes. There is no time for spreadsheets. This is the reality Fran O’Malley, Director of Product Marketing at YOOBIC, used to open the company’s session at the Retail Technology Show 2026.

Her point was direct: when 72% of retail sales still happen in physical stores (Financial Times), and when execution gaps — missed product opportunities, non-compliant displays, undetected performance variance — are accumulating across hundreds of locations every day, the cost of getting information to store managers too late, not at all, or in a format that’s difficult to act on is material. Research cited in the session puts the performance upside of closing those gaps at up to 20%.

For a deeper look at how these everyday execution gaps affect retail performance, read our guide to the retail execution gap.

The session covered two AI use cases that address this directly: the Store Manager Copilot and the VM Copilot. What follows is a structured summary of what was demonstrated, what it means for operations leaders, and why the approach produces measurable results.

Why is consistent store performance so hard to achieve across a retail network?

The problem is not a lack of data — it is a lack of relevant, timely data. Each store operates across a unique combination of cluster, footfall, staffing, assortment, and past performance. Without real-time benchmarking against comparable stores, managers default to instinct. The result: performance variation that tracks manager experience rather than store potential.

Most retail networks hold significant data — sales, inventory, workforce, customer feedback. The structural problem is that this data lives in separate systems, arrives at different intervals, and reaches store managers too slowly to influence decisions made at 9am.

As the RTS session slides framed it, each store needs a personalized set of recommendations based on its cluster, past performance, team composition, location, current KPIs, and assortment. Standard dashboards and weekly trade reports cannot deliver that level of individualization at the speed the shop floor requires.

The outcome, observed across YOOBIC’s customer base, is that performance variation between stores correlates more with manager experience than with structural factors. In the absence of clear, trusted data, all managers rely on instinct. The difference is that more experienced managers tend to focus on the right activities, while less experienced managers often spend time on work that doesn’t drive results.

Operationally, this means: retailers cannot close that variation by hiring better managers or running more training. They close it by giving every manager — regardless of experience — access to the same quality of contextualized, benchmarked insight at the same time.

Store Opportunity Analytics

How does YOOBIC’s AI turn store data into action?

YOOBIC’s AI follows three steps: connect all available store data, apply predictive AI to benchmark performance and rank opportunities by impact, then route a specific recommended action to the specific role that can act on it. The output is not a new report. It is a prioritized task, delivered to the right person before the moment of decision.

This is the same operational shift explored in our guide to retail task management, where store work moves from scattered communication to structured, trackable execution.

YOOBIC described the architecture as three linked stages: connect your data, make it smart, act on it.

How YOOBIC’s AI processes store data

1.    Connect — Unify inputs from point-of-sale, inventory, performance data, footfall , and external signals including weather and local events into a single connected view.

2.    Analyze — Benchmark each store against a comparable peer group. Identify anomalies and commercial opportunities ranked by likely revenue impact.

3.    Route — Deliver the right action to the right person. Store associates receive task guidance. Store managers get performance snapshots and opportunity alerts. District managers see cross-store rankings. HQ operations get portfolio-level compliance and campaign rollout data.

For more on how managers use mobile workflows to coordinate work on the sales floor, read how store managers use retail task management software.

The routing logic is the critical differentiator. Insight that reaches the wrong person, or the right person too late, does not change behavior. Insight that reaches a store manager before the morning briefing — in the form of one specific action — does.

“What we do not want to do is just fire tons of notifications, flood the store, nothing gets done, they just tick that they've done it, and you're in the same place as you started.”

Bradley Capon, VP Sales, YOOBIC

Operationally, this means: AI that floods store teams with low-priority alerts produces the same outcome as no AI at all. The operational value comes from constraint — surfacing the one or two actions most likely to move the KPI that day, for that specific store.

How did Hugo Boss achieve a 3.2% revenue increase with AI?

Hugo Boss had access to data, but translating it into clear, daily priorities at the store level remained a challenge. Store managers were often required to interpret multiple signals and decide where to focus, which led to natural variation in performance. As a result, some revenue opportunities went unaddressed. YOOBIC’s Store Manager Copilot was designed to close that gap. The result: 3.2% incremental revenue directly attributable to AI recommendations, delivered through three specific use cases.

O’Malley grounded the session in Hugo Boss before walking through the product. The brand’s store managers had access to data from multiple sources — spreadsheets, emails, operational systems — but extracting actionable priorities from that data was time-intensive and inconsistent. Decisions defaulted to instinct. Performance varied significantly depending on how experienced the individual manager was.

Hugo Boss: what the challenges looked like before AI

Scattered data — managers were overwhelmed with inputs but unable to identify priorities.

Inconsistent performance — results naturally varied depending on individual manager experience.

Missed opportunities — teams knew they were leaving revenue on the table but could not identify where.

AI Revenue Growth

Beyond revenue, the Copilot produced three secondary outcomes: store managers spent more time on the shop floor and less time in the back office; the team’s understanding of which KPIs actually drive performance improved measurably; and healthy competition emerged between stores once managers could see precisely how they compared to peers.

Operationally, this means: the 3.2% revenue figure is the measurable output, but the underlying change is structural — Hugo Boss moved from a network where performance depended on manager experience to one where every manager operates from the same quality of data-driven briefing.

Use case 1: Smart briefings — replacing the pre-shift spreadsheet review

The smart briefing is a daily, automated performance summary delivered before the store opens. It surfaces yesterday’s results against target, units per transaction, average basket value benchmarked against comparable stores, predicted traffic for the day, and a specific recommended focus.

In a typical scenario, a store might beat its previous day’s target, with units per transaction above average. But average product value could still lag behind comparable stores — a sign the team is optimizing for volume over value. The recommendation: prioritize higher-value products during predicted high-traffic periods. Instead of interpreting multiple reports, the store manager walks into the morning briefing with a clear, data-backed agenda.

Operationally, this means: a manager who previously spent 30 minutes cross-referencing data before a briefing now has that synthesis waiting for them. At scale, that 30-minute saving per manager per day translates into more time on the shop floor, more coaching, and more consistent execution.

Use case 2: Commercial opportunity identification — closing the gap between stores

To understand why connecting sales and operational data is so important for identifying these gaps, read why retailers need to align sales and operational data.

Every store in a retail network underperforms in at least one product category relative to comparable locations. Most of that variance goes undetected until a monthly trade review — by which point the opportunity has passed. 

Retail Sales Insights

Operationally, this means: an average of 2.4 opportunities per store per week means the revenue gap from undetected opportunities is not marginal — it is structural and recurring. 

Use case 3: KPI boosters — simulating performance before committing to action

When a KPI falls below target, a store manager faces two questions: is this gap closable today, and what specifically should I do about it? The KPI booster feature answers both.

A manager simulates the effect of a KPI shift — for example, moving units per transaction up by two points — and sees the projected impact on the day’s sales target. The system then surfaces product bundles that are performing in comparable stores, using only items currently in stock.

As Capon noted, the AI is built around the KPI agreed at project start. If average basket value is the priority, the recommendations reflect that. If volume is the focus, the logic changes. The store manager decides what to act on.

Operationally, this means: KPI simulation removes two forms of friction: managers no longer need to estimate whether a gap is closable, and they no longer need to rely on instinct or head-office guidelines to know which products to push. Both decisions are data-backed and stock-verified.

How does AI reduce the time between issuing brand guidelines and achieving compliance?

VM compliance delays are a process problem, not a people problem. Feedback loops — send guidelines, receive photos, review, return feedback, receive corrections — have historically taken days to weeks. YOOBIC’s VM Copilot breaks the loop by analyzing photos in real time at the point of execution, resolving 50% of feedback before it reaches HQ. This compresses the compliance window without adding headcount.

For a deeper breakdown of how retailers use visual merchandising software to speed up photo validation and improve compliance, read our guide to visual merchandising software.

YOOBIC processes 80 million photos per year across its client base. Until recently, every photo required human review. That volume — which grows with every new campaign and every additional store — represents a review capacity constraint that cannot be solved by hiring alone.

Retail Photo Processing

YOOBIC built the VM Copilot by first understanding exactly where review time was being lost. The research process: 50 hours of customer interviews, analysis of tens of thousands of photo comments from VM teams. The finding was precise: 50% of all HQ feedback to stores was about basic brand standards — tags showing, garments not folded correctly, boxes in the wrong position. None of this required VM expertise. All of it was consuming VM team capacity.

The Copilot analyzes each photo across three categories:

How YOOBIC’s VM Copilot analyzes each photo

Each photo is assessed against brand standards to identify execution gaps and opportunities for improvement. Store teams receive clear, actionable guidance on how to improve compliance, styling, and overall display quality.

When a store team submits a photo, the Copilot provides feedback at the moment of execution — before the image reaches the HQ review queue. Store teams receive in-moment corrections. HQ teams receive a prioritized view of the images most in need of their attention, with AI analysis already surfaced.

Operational result for VM teams

Store teams receive same-session feedback — corrections happen before the next customer walks past.

50% of HQ feedback volume is resolved at source, before it enters the review queue.

HQ VM specialists see the highest-priority images first, with AI flags already attached.

The compliance loop compresses from days to hours without adding headcount.

Operationally, this means: recovering 50% of HQ VM review capacity does not just save time — it redirects skilled VM specialists away from basic standards enforcement and toward the work that actually requires their expertise: campaign styling, display innovation, and brand elevation.

What changes operationally when AI is in place?

Operational areaWithout AIWith YOOBIC AI
Morning briefing preparation30+ minutes reviewing multiple reports and spreadsheets before store opensAutomated briefing ready before the manager arrives — no preparation required
Commercial opportunity detectionVisible in monthly trade reviews, if identified at all2.4 opportunities surfaced per store per week, benchmarked against comparable stores, in real time
Performance benchmarkingNetwork averages only; no peer-store comparison available at store levelEach store benchmarked against comparable sites by cluster, location, assortment, and past performance
VM compliance feedback loopDays to weeks, dependent on HQ review queue and team capacityReal-time in-store coaching at point of execution; 50% of feedback resolved before HQ review
KPI improvement planningDependent on manager experience; instinct-driven product selectionKPI impact simulated before action; bundle suggestions verified against current stock
Performance consistency across networkStrongly correlated with individual manager experience levelData-driven briefings reduce reliance on experience; opportunities identified consistently across all locations

Key takeaways from RTS 2026

1. The value of AI in stores is determined by routing logic, not algorithm sophistication

Insight that reaches the wrong person, or arrives after the decision has already been made, has no operational value. YOOBIC’s approach prioritizes getting the right action to the right role at the moment it can be acted on. Hugo Boss’s 3.2% revenue uplift is a routing outcome as much as a data science outcome.

2. Every store network contains recurring, identifiable revenue gaps

An average of 2.4 commercial opportunities per store per week — each benchmarked against comparable stores and verified against stock — represents a structural, recurring source of revenue that most networks leave undetected. 

3. Manager experience is the variable AI is most directly designed to level

Performance variation across Hugo Boss stores correlated with manager experience, not store potential. AI that gives every manager the same quality of benchmarked, context-specific briefing reduces that dependency. The brand moved from inconsistent, experience-dependent decision-making to consistent, data-driven execution — across its entire network.

4. The VM compliance loop is a capacity problem AI solves structurally

50% of HQ VM review time was being spent on basic brand standards that required no specialist judgment. That is not a people problem — it is a process design problem. Placing AI earlier in the review cycle recovers that capacity permanently, without additional headcount, and redirects it toward work that requires genuine VM expertise.

5. The KPI northstar must be defined before deployment, not during it

YOOBIC builds its AI logic around the KPI agreed at project start. That anchor determines what data is surfaced, what opportunities are flagged, and what actions are recommended. AI without a defined priority surfaces noise. 

Conclusion

The signal from YOOBIC’s RTS 2026 session was not about AI capability in the abstract. It was about where operational value lands when AI is deployed with a clear brief.

Hugo Boss’s 3.2% revenue increase did not come from a more sophisticated algorithm. It came from routing the right data to the right person at the right moment — before the morning briefing, at the point of photo submission, in the seconds before a KPI decision is made. Replicated across 2.4 opportunities per store per week, across a network of hundreds of stores, the aggregate is material.

For retail operations leaders, the question is not whether AI belongs in stores. According to Bradley Capon, VP Sales at YOOBIC, it will be in every store within a year. The question is what to prepare. The answer from this session is precise: define the KPI you are trying to move, identify where the data that would move it currently sits, and close the gap between those two things.

“We want to make sure that you're using that data effectively to make sure that you can drive sales.”

Bradley Capon, VP Sales, YOOBIC

Book a demo and find out how

Avoid wasted hours, blind spots
and lost revenue with YOOBIC

Frontline worker hero image
Categories
Operations Retail

Why multi-brand retail is harder than it looks — and what to do about it

What this article covers

Multi-brand retail creates operational complexity that single-brand retailers simply don’t face. This piece covers why that complexity tends to break execution, and three strategies the best-performing retail groups use to fix it:

  1. Rolling out at group level, not brand by brand. Starting with a single brand pilot is a common approach — and the reason most rollouts stall before they reach the third brand. Anchoring at group level from day one changes the outcome.
  2. Building and protecting a shared execution calendar. When group and brand communications arrive at the store floor without coordination, the result is not prioritization — it is overload. A shared calendar is the most practical fix most groups aren’t using.
  3. Aligning on a North Star KPI while preserving brand autonomy. The tension between group visibility and brand independence is real, but it is resolvable. A two-level KPI structure gives group leaders the view they need without stripping brands of the flexibility they require.

Each strategy is grounded in how retailers like SMCP, TFG, and ShopRite are running operations today.

Let’s start at the store floor

A district manager heads out for a day of store visits. On their schedule are three locations in the same mall: a Sandro, a Maje, and a Claudie Pierlot, all part of the same retail group.

Each store operates under a different set of visual merchandising guidelines, promotional calendars, and communication channels. Before they walk into the first location, they have already checked multiple systems to understand what “good” looks like in each one.

By the third store, more than an hour has gone into gathering information that should have been immediately accessible.

This is not an exception. It is the operational reality for field leaders working across multi-brand retail groups.

Multi-brand retail is one of the most complex operating models in the industry. Yet in many organizations, it is still managed as a collection of separate brands rather than a unified system. The impact is visible everywhere: inconsistent execution, fragmented communication, and missed commercial opportunities that are difficult to diagnose.

This is what a modern multi-brand retail playbook looks like, built from over a decade of working with global retail groups across fashion, grocery, and specialty.

What makes multi-brand retail operations different?

Everything your field teams are expected to do becomes structurally more complex when multiple brands are involved.

In a single-brand operation, field leaders operate within a consistent playbook. Visual merchandising guidelines, promotional cycles, and training priorities apply across every store in their territory. That consistency has real operational value, even if it often goes unnoticed.

In a multi-brand group, that consistency disappears. Field leaders are no longer focused on a single brand. They oversee three, five, sometimes ten brands within the same territory. Each brand operates on its own calendar, with its own standards, priorities, and communication flows.

The role is no longer just about execution. It becomes an exercise in constant context-switching between different operating models, often within the same day.

Why your field teams are being asked to do more with less — across more brands

The pressure on frontline teams is not new, but it has intensified. Store teams today are leaner than they were five years ago, and the expectations placed on them have grown in the opposite direction.

In a multi-brand environment, associates are generalists by necessity. A Maje store associate who steps in to cover a Sandro shift down the corridor needs to understand a different brand story, different product priorities, and different customer expectations — and they need to be ready to do it at short notice.

Head office teams face the same challenge in a different form. Brand teams manage their own use cases and nuances. Group teams sit above them, responsible for making sure execution, compliance, and guidelines are consistent across all brands. It is a demanding structure to coordinate, and it rarely runs as smoothly as the org chart suggests.

How multi-brand complexity creates execution blind spots

The most damaging consequence of this complexity is not inefficiency — it is invisibility.

When execution standards vary across brands, when field leaders are bouncing between different systems to get a view of their portfolio, and when store teams are receiving communication through a patchwork of email chains and messaging apps, no one has a clean picture of what is actually happening on the floor.

Performance gaps sit undetected. A VM standard that is consistently missed in one brand never gets escalated because no one is comparing it against the others. A promotional activation that fails in one banner does not trigger a response because the data lives in a separate system, read by a different team.

The problem compounds quietly, over time, until it shows up in revenue.

The business cost of disconnected execution

Fragmented operations have a price. And in multi-brand retail, that price gets paid across every brand in the portfolio simultaneously.

YOOBIC’s State of the Frontline research puts numbers to what most retail leaders already sense. Three figures tell most of the story:

Frontline stats: 60% understaffed, 62% disconnected from HQ, 50% no growth path.

These are not engagement scores. They are operational warning signs. A store team that feels disconnected from HQ is less likely to execute with precision. A team that sees no growth path has less incentive to get it right. When those conditions exist across multiple brands simultaneously, the execution gap widens fast.

What happens when brands operate on separate systems?

The technology picture tends to mirror the organizational one. Most multi-brand groups have not built their operational tech stack with a group view in mind. Individual brands adopted their own tools at different points, often for good reasons at the time. The result is a fragmented stack where group content gets buried, field leaders lack visibility across banners, and the feedback loop between HQ and the store floor effectively breaks down.

Too many tools means misaligned messages. A task sent from the group team conflicts with a communication pushed separately by the brand team. Store teams receive both, cannot reconcile them, and default to doing neither with full confidence.

Why store teams disengage — and what it costs the business

The downstream consequences are predictable, even if they are rarely tracked back to their root cause.

Stores that feel out of the loop stop engaging. Associates who receive inconsistent or overwhelming communication learn to filter. The promotional activation that did not land, the VM standard that slipped, the new product launch that was executed unevenly across a third of the estate — these are not individual failures. They are the cumulative result of an execution environment that was not designed for multi-brand scale.

The cost is not only operational. Missed promotions represent revenue left on the table. Inconsistent customer experiences erode brand equity. And the brands that suffer most are usually the smaller ones in the portfolio — the ones without the internal bandwidth to fight for attention when the group is stretched.

Three strategies for unified execution across brands

This is where most retailers get it wrong: they treat the multi-brand problem as a technology problem. The real challenge is organizational. Getting the structure right — the governance, the calendar discipline, the alignment on what success looks like — is what makes the technology work.

The retailers who execute well across multiple brands have figured out three things that others have not.

Strategy 1: Make it a group-wide platform, not a brand-by-brand rollout

The instinct in many multi-brand organizations is to start small — pilot with one brand, prove the value, then expand. It is a reasonable risk management approach. It is also the reason so many rollouts stall at the second brand and never reach the third.

When a new operational platform launches within a single brand, it inevitably gets shaped by that brand’s preferences, processes, and internal politics. By the time it reaches the next brand, it feels like an imposition rather than a shared tool. Field leaders who were not part of the conversation do not champion it to their stores.

The more effective approach is to anchor the rollout at group level from the start. That means securing executive alignment before build begins — not just sign-off, but genuine buy-in on what the group is trying to achieve and why a unified platform is the way to get there.

Catalyst Brands is a useful example. When SPARC merged with JCPenney to become Catalyst, bringing together brands including Eddie Bauer, Brooks Brothers, Aeropostale, and Nautica, the operational challenge was significant. The principle that drove their approach to YOOBIC was consistent: standardize the group-level foundation, then give each brand the space to configure their own experience within it.

Involving field leaders early is not optional. During YOOBIC implementations, roundtables with regional and district directors are a standard part of the process. These are the people who will determine whether the platform actually reaches the store floor — or sits unused on a shared server.

Strategy 2: Build a shared execution calendar — and protect it

One of the most underestimated sources of store-level overload is the collision of group and brand communications arriving at the same time, without coordination, with no shared sense of priority.

Store teams do not distinguish between a message from the group team and a message from the brand team. Both land with equal weight. When both arrive on the same day, both demanding action, the result is not prioritization, it’s paralysis.

The fix is structural. A shared execution calendar that coordinates content between group and brand teams, visible to everyone publishing into it, is the single most practical thing a multi-brand group can do to reduce store-level overload.

That calendar only works if people stick to it. Deviating outside planned windows should require a genuine reason — a compliance obligation, a product recall, a genuine commercial emergency. The cost of unplanned communication is rarely visible in isolation, but it accumulates in the engagement data over time.

Sharing timelines with store teams in advance is equally important. When stores know what is coming and when, they can plan. When everything arrives without warning, they can only react — and reaction is always less accurate than preparation.

Strategy 3: Align on a North Star KPI without eliminating brand autonomy

The tension at the heart of multi-brand operations is not between standardization and brand identity. It is between the desire for group-level visibility and each brand’s conviction that their situation is too specific to be measured the same way as everyone else.

Both positions have merit. And both can be resolved with a clear-headed approach to KPI structure.

The most effective multi-brand groups set a single North Star KPI at group level — conversion rate, compliance rate, or labor efficiency, depending on the sector. This is the metric that anchors every function and every brand. It is not a target imposed by the group; it is the shared definition of what good looks like.

Beneath that, brands retain full autonomy to define their supporting metrics and configure their own use cases. A grocery banner measuring floor walk efficiency will build different dashboards to a fashion brand tracking VM compliance — and they should. What matters is that both metrics roll up to a shared view of performance that group leaders can actually use.

The comparison layer is where this becomes genuinely powerful. When compliance data for Vans, Timberland, and The North Face sits in the same dashboard, the group team can see immediately which brand is falling behind, what the gap looks like at store level, and where intervention is needed. They can also see which brand is leading — and share those practices with the others.

What this looks like in practice — results from multi-brand retailers

Strategy is only useful when it produces measurable outcomes. Two examples, from different retail verticals, show what unified execution actually delivers.

How SMCP achieved a 30-point increase in VM compliance across Sandro, Maje, and Claudie Pierlot

SMCP operates over 1,600 points of sale globally across three distinct luxury fashion brands. Brand identity is non-negotiable in that business. The visual standards for Claudie Pierlot are not the same as those for Sandro. Maje has its own seasonal cadence, its own customer.

The execution problem SMCP faced was not lack of standards — it was lack of visibility. District managers could not confirm what was happening in stores between visits. VM compliance was being tracked through a combination of WhatsApp messages and emailed photos, collated manually, and always one step behind reality.

With YOOBIC, SMCP standardized task instructions with visual references that store teams could follow precisely, built daily communication loops between stores and HQ, and gave group leaders a real-time view of campaign compliance, categorized automatically by brand.

Performance stats: 30pts VM compliance, 40% on-time completion, 1.5hr saved.

The practical outcome is that SMCP’s district managers no longer need to be physically present in every store to know whether execution standards are being met. They have that visibility continuously — and can deploy their time to the stores that actually need them.

“With YOOBIC, our brands have increased in-store productivity and have taken retail execution to a higher level.”

Lorraine Ferreira, Digital, Client & Omnichannel Director, SMCP

How TFG cut execution time by 40% and lifted conversion across a multi-brand estate

TFG (The Foschini Group) operates a portfolio of retail brands across multiple geographies, including Foschini, Sportscene, G-Star Raw, and American Swiss. The challenge is coordination at scale — ensuring that execution standards hold not just within a brand, but across an entire group portfolio.

Working with YOOBIC, TFG built a unified execution layer that gave group and brand teams real-time visibility into compliance, campaign progress, and store performance — across every banner, from a single dashboard.

Performance gains: 40% faster execution, 90%+ compliance, 22% conversion improvement.

More agility. More alignment. Significantly less firefighting. 

How grocery retailers save $2–3M by eliminating execution waste across banners

Grocery is a different beast. Thin margins, high associate turnover, complex floor operations, and trade plan contracts that carry real financial penalties for non-compliance. In that environment, labor efficiency is not a performance aspiration — it is the bottom line.

ShopRite, operating over 3,600 stores and 160,000 employees across multiple banners including Checkers and OK Furniture, illustrates the challenge at grocery scale. Standardizing compliance checklists, health and safety processes, and product recall procedures across a network that size requires a level of coordination that is simply not achievable through email and spreadsheets.

With YOOBIC, grocery retailers have digitized morning floor walks, enabling store managers to assign tasks to department managers with real-time confirmation and photo evidence. Leadership gets a compliance view by region and store, all in one place. Trade plan execution — where the commercial stakes are highest — is tracked in real time.

The results are consistent: $2–3M saved across a major grocery network, higher promotional participation, and measurable time savings for store managers who can now spend more time on the floor and less time managing information.

How AI is changing the execution layer in multi-brand retail

AI is entering retail operations fast, and the conversations around it tend to jump straight to the capability layer: autonomous agents, predictive recommendations, real-time compliance scoring. The capabilities are real. But there is a precondition that does not get discussed enough.

AI cannot make a broken execution foundation intelligent. It can only amplify what is already there. If tasks are not being completed consistently, if communication is fragmented across systems, if compliance data lives in three different places — feeding that into an AI layer does not fix the problem. It accelerates it.

Why AI only works when your execution foundation is solid

The retailers who are getting genuine value from AI in their store operations are the ones who fixed the basics first. They digitized the day-to-day — visual merchandising tasks, product recalls, onboarding, upskilling — and built the data foundation that makes AI worth deploying.

Once that foundation is in place, the intelligence layer becomes meaningful. YOOBIC’s approach is built on a hierarchy: core day-to-day activities at the base, AI agents working on top of that operational data, and store copilots sitting above both — surfacing recommendations directly to store managers based on what is actually happening in their store.

What the intelligence layer looks like in a multi-brand retail context

In practice, this means a Merch Agent that reviews compliance photos without waiting for a human reviewer. A Tasks Agent that surfaces priority actions to associates based on data — not a manager’s best guess. A Business Analyst agent that flags where a brand is underperforming against its KPIs before the weekly review meeting.

For store managers, the Store Copilot means fewer dashboards to interpret and more time acting on clear, specific recommendations. For group leaders, it means the data from every brand, every banner, every region rolling into a view that they can actually use.

The integration question matters too. Large retailers typically have an existing intelligence layer — supply chain forecasting, labor planning tools, demand models. The operational platform and the intelligence layer do not need to be the same system. What matters is that they connect — so that what the agents recommend and what the store teams actually execute are part of the same feedback loop.

The most powerful outcomes come when those two layers — operational and intelligence — work together in a way that fits how the organization is already structured.

Conclusion

Multi-brand retail will always be complex. That is not a problem to be solved — it is the nature of the model. The brands are different because they should be. The customers are different. The standards are different.

What does not need to be different is the operational infrastructure that supports them. The calendar, the execution data, the communication channels, the compliance view — these can be shared without compromising a single thing that makes each brand distinctive.

The retailers getting this right are not doing anything extraordinary. They started with the right structure, aligned on a shared definition of success, and built from there. The results followed.

Frequently asked questions: multi-brand retail operations

What is the difference between multi-brand and mono-brand retail operations?

Multi-brand retail operations involve managing store execution, compliance, communication, and training across multiple distinct retail brands or banners, often with different standards, calendars, and customer expectations for each. A mono-brand retailer applies a single operational model consistently across all stores. In a multi-brand group, the challenge is maintaining group-level consistency while preserving each brand’s identity and operational requirements — a structural complexity that mono-brand retailers do not face.

How do you maintain brand identity while standardizing operations across brands?

How do you align KPIs across brands in the same retail group?

Is ongoing training realistic given how busy multi-brand store environments are?

What does good store execution look like in a multi-brand retail group?

When does standardization create problems rather than solve them?

Book a demo and find out how

Avoid wasted hours, blind spots
and lost revenue with YOOBIC

Frontline worker hero image

More than 350 retailers across grocery, fashion, specialty, and beyond use YOOBIC to run execution across brands, banners, and geographies. If you want to see what that looks like for your group, we would be glad to show you.