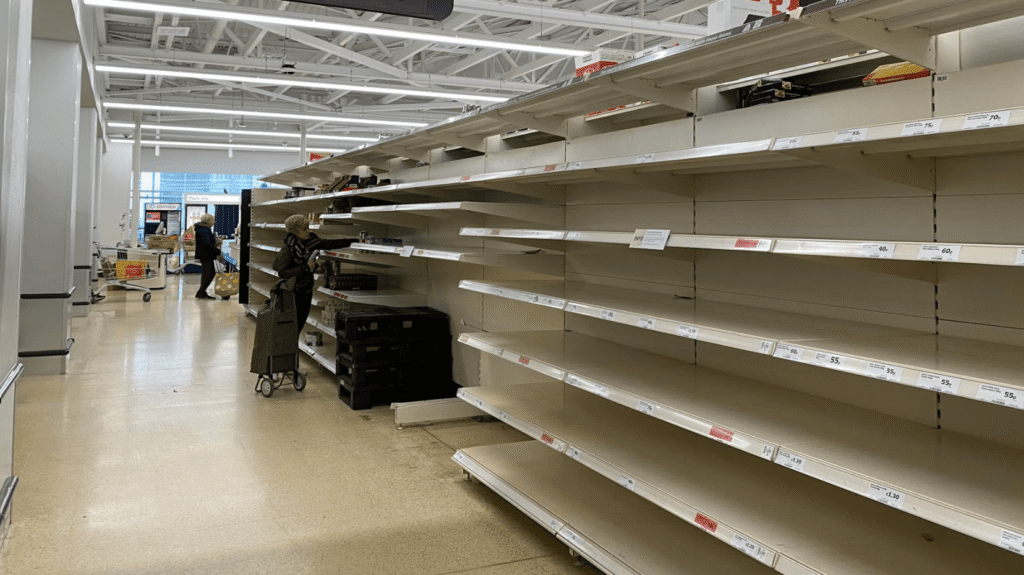
Retail shrink is the gap between the inventory your records say you hold and the stock actually on your shelves. It’s usually expressed as a percentage of sales, and it covers everything from theft to mispriced markdowns to produce that spoils before it sells. In 2022 it cost US retailers $112.1 billion, about 1.6 percent of total sales (NRF). This guide explains what shrink is, what causes it, the main types, and why it matters more to your margin than the headline number suggests.
DEFINITION:
Retail shrinkage
the difference between the stock a retailer’s system records show and the physical inventory actually present, measured as a percentage of sales. It spans external theft, internal theft, process and administrative error, supplier error, and waste.
How retail shrink is defined, and why definitions differ
Most retailers use one working definition: shrink is book inventory minus physical inventory, shown as a percentage of sales. But the trade bodies don’t fully agree on scope, and the difference is worth knowing.
The National Retail Federation frames shrink through inventory value discrepancy, and its baseline leans toward security-related loss like shoplifting, employee theft and organized retail crime. The ECR Retail Loss Group, led by Professor Adrian Beck, argues that view is too narrow. Its Total Retail Loss model separates a cost you chose to spend from a loss you didn’t, and it tracks loss across stores, e-commerce and the supply chain, not just the annual stock count. Academic work treats shrink as one component of inventory record inaccuracy, the silent mismatch between the system and the shelf.
For day-to-day operations, the practical takeaway is simple. The number on your P&L is the sales-based shrink rate, but that single figure hides very different causes underneath it.
The types of retail shrinkage
Retail shrink falls into five main types. Most loss-prevention programs are built around the first two. Most of the recoverable loss sits in the other three.
External theft. Shoplifting, organized retail crime, burglary and non-employee fraud. This is the most visible type and the one security budgets target first.
Internal theft. Employee theft, cash and refund fraud, and collusion with vendors. It’s less visible than shoplifting and often larger.
Process and administrative error. Cashier scanning mistakes, pricing file errors, unrecorded damage and bookkeeping slips. These are operational failures, not crimes, and they’re the most controllable at store level.
Supplier and vendor error. Short-shipments, substitutions and delivery mistakes that enter the system as stock the store never received.
Waste and spoilage. Damaged, expired or out-of-date product written off, which matters most in grocery and any store handling perishables.
What causes shrink, and the single biggest cause
INSIGHT
Where shrink comes from depends on the sector. In general retail, theft drives close to two-thirds of loss. In grocery, nearly two-thirds is operational. Budgeting for one when you actually have the other is why so much shrink spend misses the mark.
The biggest cause of retail shrink depends on the sector, and the two answers point in opposite directions.
In general retail, external theft leads. The NRF’s FY2022 National Retail Security Survey attributes 36 percent of shrink to external theft, 29 percent to internal theft, 27 percent to process and administrative error, 6 percent to unknown loss and 1 percent to other causes. Combined, theft accounts for close to two-thirds of general-retail shrink.
In grocery, the picture flips. Data from the Food Marketing Institute and The Retail Control Group shows that 64 percent of supermarket shrink is driven by breakdowns in store operating practices, while theft and fraud account for just 36 percent. Perishable departments alone, the meat, produce, deli and bakery counters, generate around 65 percent of total store loss.
The gap comes down to method. The NRF surveys loss-prevention and asset-protection executives, whose remit is security and crime, so their reporting leans that way. The grocery studies audit physical waste streams and department-level logs, which surface the operational losses a security survey never sees.
64% of grocery shrink is operational
In supermarkets, breakdowns in store operating practices drive 64 percent of shrink, while theft and fraud account for just 36 percent.
FMI and The Retail Control Group.
“The primary sources include external theft, internal theft, administrative errors, and supplier fraud. Each of these areas contributes differently across various retail environments, but collectively, they can significantly erode profits.”
Adrian Beck, Emeritus Professor, University of Leicester
The real cost of retail shrink
Retail shrink cost US retailers $112.1 billion in 2022, about 1.6 percent of total sales and a 19.4 percent jump on the year before (NRF). That’s the headline. The real cost is what that loss does to net profit.
$112.1 billion
What retail shrink cost US retailers in 2022, about 1.6 percent of total sales and up 19.4 percent on the year before.
National Retail Federation, National Retail Security Survey, FY2022.
The 1.6 percent average also hides wide sector variation. Grocery and supermarkets run around 2.7 percent, pharmacy and mass merchandise above 2 percent, specialty apparel near 1.9 percent, while jewelry, furniture and footwear sit below 1.5 percent. Grocery is the sharpest case: at a 2.7 percent shrink rate against average net margins of about 1.7 percent, a supermarket routinely loses more inventory to shrink than it makes in net profit.
That’s the leverage most cost conversations miss. A dollar saved on shrink is a dollar of pure net profit, because it carries no marketing, labor or cost-of-goods behind it. At a 4.5 percent net margin, recovering $100 of shrink delivers the same bottom-line profit as $2,222 in new sales. In grocery, at a 1.7 percent margin, the same $100 is worth $5,882 in sales.
22.2x
At a 4.5 percent net margin, every $100 lost to shrink takes $2,222 in new sales to recover the same profit, a 22.2x multiplier. In grocery, at a 1.7 percent margin, it climbs to 58.8x.
Beck and Peacock financial model.
Scaled up, shrink is equivalent to roughly a quarter of annual US retail profit, and closer to 60 percent in Europe where grocery margins are thinner (ECR Retail Loss). ECR’s work also shows the upside: halving retail shrink would raise average retail profit by 29 percent. Treated as a margin problem rather than a security line item, shrink is one of the highest-return things a retailer can work on.
Why shrink is really an execution problem
Underneath the categories, most shrink is a data and execution problem. Around 60 percent of inventory records are inaccurate at any given moment, and the seminal DeHoratius and Raman study found 65 percent of records wrong at the point of physical audit. When the system is wrong, the shrink number is contaminated: you can see that stock is missing, but not why.
That’s also why security-first spending so often fails to move the number. The loss a store team can actually control starts with ordinary work, receiving, counting, pricing and rotation, not with a thief. The practical response is operational, and it’s covered in detail in our guide to reducing retail shrinkage and in the discipline of consistent store visits and audits.
Getting visibility into where shrink starts
Shrink is hard to fix because it’s usually invisible until the annual count, months after the loss happened. Closing that gap means catching the operational causes as they occur. That’s what YOOBIC gives store teams: carton-level receiving with proof of delivery, scheduled cycle counts with exception alerts, and price and markdown verification through VM Copilot, which recognizes price tags with 88 to 92 percent accuracy. Every check carries a photo, a timestamp and a location, so a completed task is evidence rather than a claim.
Above the store, predictive analytics read historical audit trends and task completion rates to flag which locations are drifting before the loss shows up in a count. That turns shrink from a year-end surprise into something a field team can see and act on week to week.
“Before YOOBIC, it was difficult for us to understand the situation of our supermarkets across the country. Now we are able to monitor compliance in real time and understand our strengths and areas for improvement.”
Thibaut Lièvre, Head of Sales Organisation, Lidl France
Shrink is a number you can move
Shrink isn’t a fixed cost of running stores. It’s a measure of how well the plan survives contact with the floor. Understand where it comes from, measure it honestly, and most of it turns out to be recoverable, at a return that few other retail investments can match.
You set the standard at head office. The estate doesn’t always meet it. A planogram goes out to 400 stores, and some run it correctly on day one while others keep the old layout for another week. The promotion you signed off on launches late in a third of locations, or never goes up at all. You usually find out when the numbers land, not while there’s still time to fix it. Closing that gap is what store operations management is really about once you’re past a handful of stores.
That distance between the standard you intend and the standard your customers actually see is the compliance gap. It widens with every store you add, and across a large estate it quietly drains margin. The harder problem is that the gap is bigger than most leaders think. When store operations executives are asked, they tend to estimate in-store compliance at 80 to 85 percent. Objective audits using photo verification and digital checks put the real figure closer to 55 to 65 percent. That is a 15 to 25 point gap between what head office believes and what is on the floor.
This piece looks at why the gap is wider than it appears, what it costs across the estate, and how AI is helping operations leaders close it without adding headcount or another round of store visits.
What does store operations management include?
Store operations management is the set of processes that keep every location running to the same standard: task execution, visual merchandising, audits and compliance checks, frontline communication, and performance reporting. For a multi-site retailer, the job is less about any single store and more about consistency across the whole estate.
FFor a VP or Head of Store Operations, the work of store operations management is really about visibility and consistency at scale. You’re accountable for what happens in hundreds of stores you can’t physically stand in. Each of those areas, from task execution to visual merchandising to store audits, has usually lived in its own tool or on paper. The standard is only as good as your ability to see whether it’s being met and to act before a gap turns into lost sales. That is exactly where most operating models struggle, because the checks were built for a handful of stores, not an estate.
Why the compliance gap is wider than head office thinks
The gap starts with how directives reach the floor. Most head offices still push operational instructions through broadcast email. Average open rates from head office to frontline teams sit at 20 to 30 percent, so the majority of associates never see the visual merchandising or display priority you sent. The standard was communicated. It just wasn’t received.
From there, execution drifts. NielsenIQ data shows that up to 40 percent of custom in-store promotional displays are set up incorrectly or skipped entirely. The Promotion Optimization Institute reports that 70 percent of consumer goods companies struggle with basic store-level execution on retailer-aligned promotions. These aren’t edge cases. They’re the normal state of a large estate running on manual checks, and the reasons stores struggle with compliance tend to be structural rather than a question of effort.
DEFINITION:
The perception gap
Operations leaders estimate promotional compliance at 80 to 85 percent. Audits put it at 55 to 65 percent. More than a third of stores execute promotions incorrectly or not at all.
The last problem is time. In manual systems, store-walk reports are often reviewed three or more days after the visit. By the time a regional manager sees a promotional execution failure, the promotion may already be past the window where fixing it would matter. Worse, paper checks invite pencil-whipping. A form exists, so head office assumes the work happened. Often it didn’t. One operations leader described finding ship-readiness walks that were signed off but never actually done, only visible when someone physically picked up the clipboard in store.
Manual checklists were never built to hold a large estate to standard. An academic study of 370,000 inventory records across 37 stores found 65 percent of item records were highly inaccurate, a stark gap between what the system said and what was on the shelf. When the data itself drifts, no amount of paper auditing keeps the estate compliant.
What the compliance gap costs across the estate
Execution drift is not a soft problem. It shows up directly in margin. According to Coresight Research’s 2025 State of In-Store Retailing Study, retailers lose an average of 5.5 percent of gross sales to in-store inefficiencies, up from 4.5 percent a year earlier. Across US grocery, mass merchandise, DIY, and drugstore retail, that adds up to roughly 162.7 billion dollars in lost revenue.
The promotion economics are just as stark. CPG brands pour money into trade promotions, yet fewer than half of those promotions deliver a positive return, according to Salesforce’s 2025 Consumer Goods Industry Insights Report. The most common reason is execution at the shelf, not the promotion itself. When the display isn’t built or the planogram isn’t followed, the spend is wasted before a customer ever sees it.
Customers respond immediately. When a product is out of stock or misplaced, around 21 percent of shoppers abandon the planned purchase outright, and poor shelf compliance can pull active store sales down by up to 20 percent. The National Retail Federation puts US retail shrink at 112.1 billion dollars, or 1.6% of sales. Process error, internal theft and supplier error make up around 60% of it, and all three respond to better execution. Preventable loss is, by definition, an execution and compliance problem.
Stack these together across a 500-store estate where execution breaks down in even 30 percent of locations, and the compounded annual exposure runs into the millions in missed promotional sales, lost vendor co-op funding, and avoidable safety and pricing penalties. None of it reaches the P&L as a single line. That’s what makes it easy to miss and expensive to ignore.
How can retailers monitor shelf and planogram compliance across multiple stores?
The reliable way to monitor compliance across many stores is to make execution visible in real time. That means digital checklists for daily routines, photo validation for merchandising and compliance, and dashboards that show head office which stores are on standard now, not three days later.
Three capabilities do most of the work here. First, digital checklists and task management replace paper logs and scattered spreadsheets with mobile tasks sent straight to the floor, so expectations are clear and completion is tracked. Second, store audits move from self-reported sign-off to photo validation. Staff submit photos of finished displays in the app, and head office or regional teams run virtual store visits, leaving annotations and corrective actions directly on the images. Third, real-time dashboards pull it all into one view, so leadership can spot an underperforming store and act the same day.
The shift this enables is the important part. You move from reactive, bi-weekly physical audits to continuous visibility. Reporting lag compresses from three or more days to real-time. That’s the difference between catching a missed promotion while it can still be fixed and reading about it after the window has closed. For a deeper walk-through, see our guide to improving retail compliance with task management.
Where AI closes the compliance gap
Real-time visibility tells you where the gaps are. AI is what lets a lean operations team act on every one of them across hundreds of stores at once. This is where modern retail operations software earns its place, by handling the volume of checks and decisions that no regional team could cover by hand. YOOBIC builds this into a set of AI teammates that sit inside the daily workflow.
Store Manager Copilot
Store Manager Copilot is an AI teammate that reads live store data and turns it into prioritized action. It ranks opportunities by revenue impact and gives the store manager a clear menu for success, so they know which commercial gap to close first instead of guessing. It puts the manager’s attention where it pays back the most.
VM Copilot
VM Copilot uses AI image recognition to check that displays and campaigns are set correctly against brand standards. It flags execution gaps at the moment of execution and resolves around 50 percent of floor feedback instantly, before the photo ever reaches the head office review queue. That matters because YOOBIC’s own research found half of all HQ feedback to stores was about basic standards: tags showing, garments folded wrong, boxes out of place. Catching those on the floor clears the bottleneck that used to take days.
AI Assistant
YOOBIC’s AI Assistant is a conversational tool where associates ask plain-language questions about store procedures, policies, or product details and get an immediate, validated answer on their mobile device. It removes the wait for a manager or a buried document, which is often the reason a task gets done wrong or skipped.
The wider industry is proving the same direction works. BJ’s Wholesale Club deployed autonomous shelf-scanning vision across its network and cut out-of-stocks by 60 percent and pricing and promotional execution errors by 90 percent. Appriss Retail’s agentic tool now distills return and audit patterns that used to take 45 minutes of manual work into a plain-language briefing in under five. McKinsey found that retailers running regular visual merchandising audits see up to a 25 percent lift in promotional compliance. The pattern is consistent, and it’s already underway: AI is changing retail execution at the point where the work happens. If you’re early in this, our guide to AI in retail for store operations is a good place to start.
What this looks like across the estate
The proof shows up in compliance and audit numbers across real multi-site estates. The figures below come from YOOBIC customer stories, with each brand running these capabilities at scale.
Michaels
98% compliance in daily customer readiness walks223,000 hours saved across 1,350 stores$1.8M in incremental revenue, year one
Lidl
11% increase in company-wide compliance98% cold chain maintenance over the past year
CELINE
100% of stores audited within 6 months98% of audited stores compliant
Canada Goose
25% increase in VM executionTwo-week feedback loop cut to hours+2pt conversion rate lift
Van Cleef & Arpels
100% validation across stores6-day VM validation reactivity
“Within seconds in the boardroom I can pull up the platform and validate execution across the entire chain.”
Chris Freeman, SVP of Store Operations, Michaels
“Before YOOBIC, it was difficult for us to understand the situation of our supermarkets across the country. Now we are able to monitor compliance in realtime and understand our strengths and areas for improvement.”
Thibaut Lievre, Head of Sales Organisation, Lidl
How to close the gap efficiently
Operational efficiency in retail is not about working the estate harder. It’s about removing the manual load that hides the gap in the first place. Five moves do most of the work.
Replace broadcast email with mobile-first tasks. Send role-based, prioritized tasks straight to associates’ devices so the standard actually reaches the floor, instead of sitting unread in an inbox.
Require photo proof of execution. Make task completion depend on a photo, not a tick box. This sets a reality gate that stops a display being marked done while it’s still unbuilt.
Give managers their floor time back. Store managers lose a large share of their week to admin, and district managers coach as little as ten minutes a day. Automating the checks and reporting moves that time back to in-aisle coaching and audits, the work that actually holds standards. It’s one of the clearest challenges a retail operations leader can fix.
Move to continuous shelf visibility. Shift from periodic physical audits to AI and photo validation that compare the shelf against the planogram in real time, then push prioritized fixes to the floor before the customer sees the gap.
Unify the data. Bring task completion, audits, and performance into one connected view so leadership sees the whole estate at once and can tell, today, which stores are on standard and which are drifting.
What changes when you do this
Audit reporting moves from three-plus days to real-time. Area manager admin drops from ten-plus hours a week to under two. Compliance consistency moves from the typical 40 to 60 percent range toward 70 percent and above.
Close the gap across your estate
The compliance gap is an execution problem, and execution problems are fixable. See how YOOBIC helps retailers run a consistent estate, with real-time visibility, photo-verified audits, and AI teammates built for the floor.
Book a demo and find out how
Avoid wasted hours, blind spots
and lost revenue with YOOBIC
AI is used in retail to forecast demand, align staffing to real foot traffic, flag shrink at checkout, and verify in-store execution. It also powers mobile assistants that hand associates stock levels, product details, and answers on the floor. The biggest gains sit inside the store, where AI turns data into the next task a team should act on.
What is the 30% rule in AI?
The 30% rule is a guideline for splitting work between AI and people. AI handles around 70% of repetitive, data-heavy tasks, and humans keep the remaining 30% for judgment, creativity, and decisions that carry real consequences. In a store, that means AI can draft the schedule or flag an empty shelf, while managers make the call on how to act.
Which AI tool is best for retail business?
The best AI tool depends on the problem you’re solving. For store operations, look for one that connects to daily work, task management, frontline communication, and learning in a single app teams already use. YOOBIC brings those together with AI built for store teams, which is why adoption holds at 90% on the floor.
Is AI going to replace retail jobs?
No. AI is changing retail jobs more than replacing them. It takes over repetitive admin like stock checks, reporting, and manual scheduling, which frees store teams to spend more time with customers. The roles that grow are the ones that pair human judgment with AI doing the heavy lifting.
Is AI replacing cashiers?
AI is changing retail jobs more than replacing them. It strips out low-value routine work like stock checks, reporting, and manual scheduling, so store teams can spend more time on customers and the decisions that need judgment. The roles that grow are the ones that pair human judgment with AI doing the heavy lifting.
What are the 4 types of AI?
The four types of AI are reactive machines, limited memory, theory of mind, and self-aware AI. Reactive machines respond to inputs with no memory. Limited memory systems learn from recent data, which covers most AI in retail today, from demand forecasting to recommendations. Theory of mind and self-aware AI are still theoretical.
Most retail recognition advice falls apart at scale. This piece focuses on ideas that hold up across multi-location retail: small awards for many rather than large awards for few, visible across the network rather than buried in a back office, and frequent, specific, and simple enough that a busy store manager can actually do them on a Tuesday afternoon.
If you take one thing from what follows, take this: the retailers winning on retention aren’t running bigger recognition programs. They’re running more frequent ones.
Why retail recognition breaks down in most stores
Most retail recognition runs hot at the top and cold on the shop floor. Heineken’s traditional program reached less than 2% of its 2,400 employees each year. The pattern is common, and the cost is measurable. Employees who feel unseen or undervalued are 60% more likely to disengage or leave.
The upside is just as clear. Frequent, specific recognition has a 0.455 correlation with employee engagement, and well-recognized employees are 45% less likely to have turned over two years later.
Recognition isn’t a perk. It’s the daily signal that tells your store teams whether their work matters.
12 retail recognition ideas built for scale
1. Make recognition daily, not annual
Annual awards reach a handful of associates. Daily recognition reaches everyone. Build a regular cadence into how store managers run the day: a 90-second shoutout in the morning huddle, a short message at the end of a shift, one specific moment named every day. It costs nothing, needs no extra platform, and lifts engagement faster than almost any other change you can make.
2. Recognize non-sales achievements during peak season
During peak, sales numbers get all the attention. But the associate who covered a colleague’s shift, calmed a frustrated customer, or kept the stockroom clean while five new hires onboarded is doing work that holds the store together. Name the behaviors you want repeated, not just the outcomes you want hit. That’s how culture spreads at scale.
3. Build peer-to-peer recognition into your daily comms tool
Manager-led recognition can’t reach every associate. Peer-led recognition can. Give store teams a simple way to recognize each other inside the daily communications tool they already use. Mattress Firm uses in-app shoutouts this way to keep peak-season teams motivated.
4. Borrow the BREWards model: small, frequent, brand-aligned
Heineken rebranded its recognition program as BREWards, with names like IPAs (Inspiring People Awards) and Cheers! instant awards worth $65 each. By shifting from large awards for few to small awards for many, the company lifted peer-to-peer recognition by 50%. The lesson isn’t to copy the names. It’s to make recognition feel like part of your brand.
5. Recognize the behaviors you want repeated, not just the outcomes
“Great month on sales” tells an associate nothing about what to keep doing. “You spent ten minutes with a customer who was clearly overwhelmed, and you closed a $400 sale by listening first” tells them exactly what to repeat. Specific recognition works as on-the-job coaching. Generic recognition works as background noise.
6. Make recognition visible across the wider store network
A great moment locked inside one store stays inside one store. The same moment shared across your network becomes a cultural signal. Other stores see what good looks like, and new hires absorb the standard without needing a training session. This is why a connected platform for culture and community matters more than a standalone recognition program.
7. Tie recognition to your store values, not just sales targets
If every recognition moment names a sales number, you’re telling store teams the till is the only thing that matters. That works for a quarter, but it doesn’t build a culture. Tie recognition to the values your brand stands for: customer service, teamwork, product knowledge, inclusion. The associate who lives those values is the one who keeps your standards intact when no one from HQ is watching.
8. Equip area managers with recognition rituals, not just review forms
Area managers are the connective tissue between HQ and the store floor. Most carry review templates and KPI dashboards. Very few carry a recognition ritual. Give them a structured one: a single named recognition per store visit, captured in the app and shared across the region. It takes five minutes per visit, and it compounds across a quarter.
9. Recognize new hires in their first week, not after 90 days
Most new hires who quit decide to leave in the first two weeks, often before anyone has formally recognized them for anything. Build a recognition moment into the first week, tied to their first completed task or their first good customer interaction. Recognized early in onboarding, new hires are far more likely to reach the 90-day mark.
10. Give store managers a recognition budget, not just permission
Permission to recognize is theoretical. A budget makes it operational. Even a small monthly amount per store, set aside for recognition, changes how a manager behaves. A $50 monthly budget per store, used to fund five $10 moments, lifts morale further than a single $500 quarterly award.
11. Use cross-store leaderboards to drive friendly competition
Frontline retail roles are social by nature. Healthy competition between stores lifts engagement and execution at the same time, as long as it’s framed around shared goals rather than individual exposure. Build leaderboards that recognize the top three stores on a specific behavior each week: mystery shopper scores, promo execution, or customer compliments captured.
12. Close the loop: tell employees when their recognition reached HQ
Recognition that stops at the store level is good. Recognition that visibly reaches HQ is better. Give store managers a structured way to escalate standout moments upward, and give HQ a way to acknowledge them back. A monthly executive shoutout video, a regional roundup, or a direct message from a VP all work. Recognition that travels in both directions tells the store team they’re part of something larger.
The compound effect of consistent recognition
These ideas aren’t meant to be run once. High-quality recognition has a 0.455 correlation with employee engagement, established in joint Gallup and Workhuman research, and that’s one of the strongest workforce correlations on record. Well-recognized employees are 45% less likely to have turned over two years later. Run twelve of these habits consistently and the effect isn’t additive. It builds on itself over time.
If you want to track that link, start by measuring engagement on a regular cadence, so you can see recognition show up in the numbers.
What this looks like in practice
BurgerFi: recognition built into network scaling
As BurgerFi scaled its network quickly, recognition became part of how new locations got up to speed, not a separate program bolted on afterward. See how BurgerFi improved its frontline employee experience with YOOBIC.
GANT: recognition that travels across a global community
When GANT built a global community of store associates, recognition stopped being a single-store practice and became a network signal. Store teams across continents see what good looks like in real time. Peer recognition, manager recognition, and HQ recognition travel between each other in one connected feed, which is what makes recognition work across hundreds of locations.
Five recognition habits to start this week
One named recognition per store per day, captured in your daily comms tool.
A small monthly recognition budget for every store manager, even $50.
A recognition ritual on every area manager store visit: one named moment, shared across the region.
A recognition moment built into every new hire’s first week, not their 90-day review.
At least one piece of recognition per store made visible across the entire network, every week.
See how leading retailers run recognition at scale
YOOBIC helps brands like BurgerFi, GANT, PureGym, and UNTUCKit make recognition visible across thousands of store associates, daily, peer-to-peer, and connected to the work that drives store performance. Book a 20-minute walkthrough to see how it would work in your store network.
Retail employee recognition is the practice of acknowledging the performance, behaviors, and contributions of frontline store associates and store leaders. Effective recognition is frequent, specific, timely, and visible. Done well, it has a 0.455 correlation with employee engagement and reduces two-year turnover by 45%. Done poorly, it reaches less than 2% of employees and has no measurable effect.
What’s the difference between recognition and appreciation?
Recognition acknowledges performance. Appreciation acknowledges value as a person. Recognition tells an associate that their work hit a standard. Appreciation tells them they matter to the team beyond their output. Strong retail recognition programs include both. Recognition drives productivity in the short term, and appreciation drives commitment over the long term.
How often should retail employees be recognized?
Employees who receive meaningful recognition at least monthly see a 7.87% reduction in burnout and are significantly less likely to leave within two years. Daily recognition at the store level is the operational gold standard. Frequency matters more than size, because small, frequent moments outperform large, infrequent awards every time.
How do you scale recognition across multiple store locations?
Scaling recognition takes three things: a connected platform that lets recognition travel between stores, a structured ritual that fits inside the store manager’s existing day, and visible HQ involvement that signals recognition is a business priority. Retailers like BurgerFi and GANT scale recognition by building it into the same mobile platform their store teams already use for tasks and communications.
Does peer-to-peer recognition actually work in retail?
Yes. Heineken’s BREWards program, which shifted from large awards for few to small awards for many, lifted peer-to-peer recognition by 50%. In retail, peer recognition works because frontline roles are inherently social and because peers see the work managers miss. It’s most effective when it’s built into the tool teams already use daily, not run as a separate program.
Artificial intelligence is reshaping every layer of the retail industry, from the supply chain to the shop floor, from pricing strategy to the checkout line. Recent data shows 89% of retailers are now using or testing AI, and McKinsey estimates that generative AI alone could unlock $240–$390 billion in value for the sector globally.
But “AI for retail” isn’t a single technology or a single use case. It’s a landscape of specialized tools spanning demand forecasting, dynamic pricing, loss prevention, personalization, in-store analytics, marketing automation, and frontline operations. Some of these solutions work behind the scenes, optimizing algorithms that customers and store teams never see. Others put AI directly into the hands of the people running the stores.
This guide covers the 20 most impactful AI solutions for retail in 2026, organized by the problem they solve rather than by hype. Whether you’re a VP of Operations improving store execution, a supply chain leader reducing waste, or a marketing team personalizing the customer journey, this list will help you find the right AI tools to move your retail performance metrics in the right direction.
AI for frontline operations, training, and store execution
1. YOOBIC: best AI platform for frontline retail teams
Every other AI solution on this list optimizes what happens to products, prices, data, or customers. YOOBIC optimizes what happens with the people who actually make retail work: the store managers, associates, and field teams who execute thousands of tasks, absorb constant change, and deliver the customer experience every day.
YOOBIC’s AI-powered platform increases productivity, accelerates learning, and helps every retail employee perform at their best. AI is embedded across the entire platform rather than bolted on as a feature. It powers task management, frontline communications, and mobile learning in a single app that already supports millions of workers on every shift.
AI that creates and personalizes learning
YOOBIC’s AI course creator generates interactive training modules from existing SOPs, product specs, and brand guidelines in minutes, cutting content creation time dramatically. AI personalizes learning paths based on role, performance, and behavior, then retests to strengthen retention. Longchamp saves 10 hours per week on content creation. Moschino achieved 98% course completion across 150+ global stores.
AI search that answers questions on the floor
The AI Assistant gives frontline teams instant, accurate answers about store procedures, product details, and policies. It uses existing documentation to resolve queries in seconds and reduces the volume of support requests to HQ.
PureGym shows what that looks like at scale. In the first month alone, teams asked nearly 2,000 questions and resolved them on the spot, without routing through managers or central inboxes. That kept leaders focused on higher-value work and gave central teams a clear read on where knowledge gaps sat.
AI that drives store performance
Store Manager Copilot combines store performance data with operational activity and external signals to deliver prioritized, actionable recommendations in natural language. Store teams don’t need more dashboards. They need clarity. Copilot delivers it by turning store data into the actions that move the KPIs that matter today. It’s built on technology from YOOBIC’s acquisition of Humanitics, a pioneer in AI-driven retail analytics.
AI image recognition for visual compliance
VM Copilot uses AI-powered photo verification to assess whether in-store campaign execution meets brand and campaign standards. It removes manual photo reviews, delivers instant corrective feedback to store teams, and gives HQ real-time visibility into execution quality across every store.
YOOBIC was named in six 2025 Gartner® Hype Cycle™ reports and ranks #1 on G2 across Retail Execution and Retail Task Management. Over 350 global brands use the platform in 21+ languages, including H&M, Boots, Lidl, Lacoste, Michaels, GameStop, and Morrisons.
Best for: Retailers looking for AI that empowers the people running the stores, not just the systems behind them.
AI for supply chain and demand forecasting
2. Blue Yonder
Blue Yonder is the enterprise standard for AI-powered supply chain planning. The platform uses machine learning, causal factor analysis, and agentic AI to model demand, optimize replenishment, and manage inventory across complex multi-warehouse operations. Blue Yonder processes 27 billion AI/ML predictions per day and has been named a Gartner Magic Quadrant Leader for Supply Chain Planning for 12 consecutive years. Published benchmarks include a 12% improvement in forecast accuracy and a 30% one-time inventory reduction. Customers include DHL, Starbucks, and Tesco.
3. RELEX Solutions
RELEX specializes in AI-driven demand forecasting and automated replenishment for retail and grocery. The platform connects merchandising decisions with space planning, so what’s forecasted actually fits the shelf. That distinction matters in fresh and perishable categories, where waste reduction is a direct margin lever. The platform incorporates promotional calendars, seasonal patterns, and external signals like weather into SKU-level forecasts.
4. o9 Solutions
o9 is the cloud-native disruptor in supply chain planning. Its “Digital Brain” platform integrates demand, supply, and inventory planning with real-time scenario simulation, letting teams instantly recalculate across the entire chain when conditions change. It was named Gartner Customers’ Choice 2025. Customers include Amazon, PepsiCo, Walmart, and AB InBev. The AB InBev deployment achieved a 20% inventory reduction, 87% forecast accuracy, and out-of-stocks below 0.5%.
AI for shelf intelligence and availability
5. Focal Systems
Focal Systems puts AI-powered cameras on the shelf edge to give retailers real-time visibility into product availability. The cameras scan shelves continuously, detect gaps and out-of-stocks as they happen, and turn that data into specific actions for store teams rather than relying on manual checks. Focal won In-Store Technology of the Year at the 2026 Retail Systems Awards.
What makes shelf-level AI like this most useful is what happens to the data next. On its own, a camera tells you a shelf is empty. Paired with a task management platform like YOOBIC, that signal becomes a task routed to the right person, so teams act on exceptions as they happen instead of walking the floor on a fixed routine. The camera spots the problem, and the workflow drives the fix. It’s a practical example of why connected tools tend to outperform standalone ones, and of how the right pairing can lift availability, productivity, and the performance metrics that follow.
Best for: Grocery and high-volume retailers who want shelf-level AI that routes problems to the people who can act on them.
AI for personalization and customer experience
6. Dynamic Yield (Mastercard)
Dynamic Yield is an AI personalization and experimentation platform for enterprise-scale brands, backed by Mastercard’s transaction data for predictive personalization. The platform delivers real-time product recommendations, content personalization, A/B testing, and multivariate experimentation across web and app. It’s been named a Gartner Leader in personalization for seven consecutive years. Retailers report 15–25% conversion improvements from AI-driven personalization.
7. Bloomreach
Bloomreach powers autonomous search, conversational shopping, and personalized marketing for 1,400+ brands including Bosch, Puma, and Marks & Spencer. Its native customer data platform removes the need for separate CDP tools, unifying real-time customer and product data across every channel. Forrester validated a 251% ROI. Bloomreach is positioned as an agentic platform where AI autonomously personalizes the entire customer journey from search to purchase.
8. Algolia
Algolia provides AI-powered search and discovery infrastructure used across retail, media, and SaaS. The developer-friendly, API-first platform powers billions of queries and helps retailers deliver fast, relevant product search results that adapt in real time based on user behavior. Retailers using AI-powered search consistently report 15–35% revenue lifts compared to keyword-only search.
9. Constructor
Constructor is purpose-built for large-catalog ecommerce, optimizing search and browse results specifically for revenue and conversion rather than text relevance alone. The platform uses behavioral signals and business KPIs to rank products, which sets it apart from search tools that optimize for clicks or relevance only. It’s strong with enterprise retailers managing catalogs of 100,000+ SKUs.
AI for pricing optimization
10. Competera
Competera uses contextual AI to analyze over 20 pricing and non-pricing factors and generate optimal price recommendations across an entire retail assortment. The platform balances sell-through, traffic, and margin simultaneously at the portfolio level. Published results include +3–7% revenue growth and +2–5 percentage point margin uplift. Its human-in-the-loop design lets pricing teams review, adjust, and approve recommendations before anything goes live, a critical requirement for enterprise retailers.
11. Revionics
Revionics combines 20+ years of retail pricing expertise with predictive AI, conversational AI, and agentic AI. Deployed on Google Cloud (Cloud Partner of the Year), the platform optimizes base pricing, promotions, and markdowns using demand elasticity modeling and competitor intelligence. It’s strong in grocery and apparel, where pricing complexity and seasonal dynamics make manual optimization impractical at scale.
AI for loss prevention and computer vision
12. Everseen
Everseen is a Vision AI leader trusted by 11 of the top 20 global retailers. The platform monitors over 140,000 checkouts, captures 15 million customer interactions daily, and processes 6 petabytes of video per day. Its AI detects unscanned items, scanning errors, and loss-related behaviors in real time at both self-checkout and staffed kiosks. At NRF 2026, Everseen unveiled Everact, an agentic AI prototype that adds a conversational intelligence layer, letting store managers query video data in natural language. Customers include Kroger, Phillips 66, and Tesco.
13. Grabango
Grabango retrofits existing stores with computer vision for checkout-free shopping, with no store redesign required. Aldi launched ALDIgo powered by Grabango, becoming the first major US grocery retailer to deploy checkout-free technology in an existing full-size store. A 37,500-transaction study across partner stores documented a nearly 60% decrease in partial shrink from theft and scanning errors.
14. Trigo
Trigo powers autonomous shopping for major European grocery retailers including Tesco, Aldi, and REWE. The platform uses ceiling-mounted cameras and shelf sensors to identify products as shoppers pick them up, enabling grab-and-go experiences without requiring customers to scan. Trigo’s technology is designed for full-format supermarkets, not just small convenience stores, a technical distinction that sets it apart in the autonomous retail space.
AI for in-store analytics and location intelligence
15. RetailNext
RetailNext is the leading in-store traffic analytics platform, used by 450+ retail brands. Its proprietary Aurora AI sensor uses patented deep learning for foot traffic counting, path analysis, heatmaps, and dwell time measurement, covering over 1 billion shopping trips per year. The platform integrates traffic data with POS and staffing systems, helping retailers optimize conversion rates, labor scheduling, and store layouts based on actual shopper behavior rather than intuition.
16. Placer.ai
Placer.ai provides AI-powered foot traffic and location intelligence using anonymized mobile data. The platform gives retailers, restaurants, and commercial real estate teams real-time visibility into foot traffic trends, trade area demographics, competitive benchmarking, and customer cross-shopping behavior. It’s widely used for site selection, market analysis, and measuring the impact of marketing campaigns on physical store visits.
17. Sensormatic Solutions (Johnson Controls)
Sensormatic Solutions, celebrating 60 years of retail innovation, combines legacy EAS anti-theft hardware with AI-enabled analytics for traffic, loss prevention, and RFID-based inventory intelligence. The TrueVUE platform provides a unified view of inventory across stores and warehouses. The new Orbit AI technology, deployed with LIDS, uses AI cameras to analyze how shoppers move through stores, helping retailers optimize layouts, staff placement, and merchandising.
AI for retail marketing and customer engagement
18. Klaviyo
Klaviyo is the dominant AI-powered marketing automation platform for DTC and retail ecommerce, powering email, SMS, and push notifications for 167,000+ brands. AI-driven segmentation, predictive analytics (predicted lifetime value, churn risk, next purchase timing), and automated campaign flows make it the standard for data-driven retail marketing. It has strong native Shopify integration. Klaviyo IPO’d in 2023, confirming its position as a category leader.
19. Insider
Insider is a cross-channel customer engagement platform orchestrating personalized campaigns across web, mobile app, email, SMS, and WhatsApp. Named a Gartner Magic Quadrant Leader, the platform serves 1,200+ brands including Samsung, Adidas, and Estée Lauder. It’s particularly strong in mobile engagement and lifecycle marketing for retailers with global, multi-channel customer bases.
AI for fulfillment and location planning
20. Ocado Technology
Ocado’s AI-powered automated fulfillment platform represents some of the most advanced robotics in retail. Thousands of robots coordinate on a grid-based system, using AI route optimization and machine learning to pick and pack grocery orders in minutes. The technology is licensed by major retailers worldwide including Kroger (US), Coles (Australia), Lotte (South Korea), and Grupo Éxito (Colombia). Ocado’s AI handles everything from demand prediction to robotic choreography, a genuine showcase of what AI-driven automation looks like at scale.
How to navigate the retail AI landscape
The breadth of this list reflects a reality about AI in retail: there is no single “AI solution” that covers everything. Retailers are assembling ecosystems of specialized tools, each solving a distinct problem, from how products get to the store to how they’re priced, protected, promoted, and sold.
Start with the problem, not the technology
AI adoption that starts with “we need an AI strategy” tends to produce expensive pilots that don’t scale. AI adoption that starts with a specific number, like “37% of our promotional displays are executed incorrectly” or “we’re losing 3% of revenue to shrink,” produces measurable ROI. Identify the operational, commercial, or customer experience gap, tie it to the performance metric you want to move, then find the AI tool built to close it.
The most under-invested layer is the frontline
Most retail AI investment to date has flowed into back-office and digital operations: supply chain, ecommerce personalization, pricing algorithms, and marketing automation. These are important, but they all depend on one thing, the people in the stores executing correctly.
A perfectly optimized demand forecast still fails if the product sits in the stockroom instead of the shelf. A flawless promotional plan still fails if associates don’t know about it. An AI-generated planogram still fails if nobody verifies it was set correctly. The store floor is where AI’s promise meets retail’s reality, and it’s the layer where most retailers have invested the least.
Connected platforms outperform point solutions
As this list makes clear, the AI tools available to retailers are increasingly powerful, but they’re also increasingly fragmented. One tool for pricing, another for demand forecasting, another for loss prevention, another for marketing. Each generates data, but that data often lives in silos.
The retailers seeing the strongest results are the ones connecting their AI investments into unified workflows. When shelf data triggers a task, when training data connects to execution data, when performance insights drive prioritized actions, and when the frontline team has a single app instead of a dozen logins, that’s when AI stops being a pilot and starts being operational infrastructure that moves real KPIs.
Why YOOBIC leads this list
“Real life drill: in the boardroom, and I’m being asked about a particular merchandising set. Within seconds I’m able to pull up the platform and take a look at execution across the entire chain, and validate whether we’ve gotten everybody across the finish line or where the gaps are.”
Chris Freeman, SVP Operations, Michaels
The 19 other AI solutions on this list are genuine category leaders, each solving a critical piece of the retail puzzle. But none of them solve the most fundamental challenge in retail: making sure the people on the store floor have the intelligence, the training, and the tools to execute correctly, every day, across every location.
YOOBIC is the AI-powered platform built for that challenge. From AI-generated training content to real-time image analysis for merchandising compliance, from the AI Assistant answering questions on the floor to Store Manager Copilot prioritizing the actions that will move sales today, YOOBIC puts AI directly into the hands of the people who determine whether every other investment on this list actually pays off.
For retailers ready to bring AI to the most important layer of their business, the frontline, YOOBIC is the place to start.
YOOBIC is the leading AI-powered retail operations platform, trusted by 350+ global brands. Request a demo to see how YOOBIC can transform your frontline operations.
Book a demo and find out how
Avoid wasted hours, blind spots
and lost revenue with YOOBIC
The district manager role was defined for decades by a straightforward operating logic: visit stores on a fixed schedule, check standards against a list, and report findings back to headquarters. The DM was, functionally, a compliance auditor with a travel budget.
That model rested on a set of assumptions that no longer hold. It assumed that physical presence was the primary driver of execution quality. It assumed that a scheduled circuit of stores would surface problems in time to fix them. And it assumed that the DM’s judgment, applied consistently across a territory, was sufficient to bridge the gap between what HQ intended and what the store floor delivered.
The data tells a different story. HQ leaders consistently estimated compliance across their store networks at between 80% and 85%. Systematic audits put the actual figure at 55% to 65% (YOOBIC proprietary research). That 20-percentage-point gap was not a performance anomaly. It was a structural failure of the operating model.
KEY STAT:
55-65%
Actual compliance rate across retail store networks vs. 80-85% estimated by HQ
KEY STAT:
$10M-$40M
Annual value lost by large retailers to inconsistent execution
The visits were happening. The gap remained. And the cost of that gap, in lost promotional sales, missed execution windows, and brand inconsistency, ran to between $10 million and $40 million annually for large retailers (YOOBIC proprietary research). More frequent visits to the same model would not have closed it.
Five structural forces that made the old model unsustainable
The shift in the district manager role was not a strategic choice made in an executive offsite. It was a forced response to pressures that converged between 2020 and 2025 and collectively made the legacy operating model untenable.
Chronic labor turnover and the hiring burden
Frontline retail turnover sits at around 60% for many organizations, and the DM has absorbed most of the operational fallout. During peak periods, district managers can spend 40% to 60% of their time on hiring logistics rather than field leadership (Humanly). For a retail chain running 1,800 hires annually, that represents the equivalent of 1.7 full-time DMs absorbed entirely by screening and scheduling (Humanly). The field leadership layer was effectively functioning at half capacity before it reached the store floor.
Expanding spans of control
The average U.S. manager now oversees 12.1 direct reports, nearly 50% more than in 2013 (Gallup). In retail operations, where DMs may carry 15 or more stores, that expansion has a direct structural consequence: it is no longer possible to maintain meaningful engagement with every location on a uniform visit schedule. Geography and time impose hard limits that a calendar-based model cannot accommodate.
Information overload and signal dilution
The volume of operational communications reaching the store floor has grown faster than the capacity to process it. Store managers in 2025 are navigating 200 emails a day and 40-page program manuals (YOOBIC). The effect is signal dilution: 67% of HQ leaders acknowledge that their messages are routinely ignored or deprioritized at store level, not because of disengagement, but because teams have no room to absorb one directive before the next arrives (Zipline). The DM has increasingly been required to act as a communications filter, a role that consumes capacity better spent elsewhere.
Margin pressure and the cost of execution failure
Poor retail execution has always had a financial cost. What has changed is the tolerance for it. Margin compression across grocery, specialty, and fashion retail has made operational waste an existential concern rather than a rounding error. A mid-sized network with inconsistent execution loses over $5 million in preventable costs annually, including $3.9 million in missed promotional sales (YOOBIC). When 30% of stores fail to execute a promotion correctly, the revenue impact is not recoverable post-event (YOOBIC).
The rise of hybrid expectations and remote accountability
Hybrid working expectations have reached the field leadership layer, creating a structural tension. The district manager role requires physical presence to be effective, yet organizations face pressure to reduce travel costs and support more flexible working models. Gallup research indicates that fully remote managers face measurable limits on their effectiveness, particularly in large teams, because the coaching and rapport-building that drive engagement require in-person contact. The DM cannot be replaced by a dashboard. But the model cannot sustain the travel overhead of the pre-2020 approach either.
The operating model is being redesigned, not just optimized
The response to these pressures has not been to do more of the same more efficiently. It has been a redesign of how the district manager role is structured, what it is accountable for, and how it uses time.
The most visible dimension of that redesign is the shift from a fixed visit schedule to a risk-based, data-triggered model. Instead of completing a geographic circuit on a predetermined cadence, high-performing field organizations now allocate DM time according to where execution risk is highest. A store whose average receipt value is declining or whose task completion rate has dropped becomes a priority visit. A store performing consistently against its targets may be monitored remotely and visited less frequently.
The second dimension of redesign is the reallocation of what DMs actually do. In the legacy model, the district manager was an individual contributor who happened to manage people. A significant share of their time was spent on tasks, reporting, and administrative functions that could, in principle, be handled by a system. In the redesigned model, that administrative overhead is being systematically reduced so that the DM’s time is concentrated on the activity that no system can replicate: developing, coaching, and enabling the people responsible for store performance.
The third dimension is the shift from store-level focus to portfolio-level optimization. A DM managing 15 stores cannot treat each location as an independent engagement. The modern operating model requires them to think across the network: which stores are dragging portfolio performance, where is the highest-value intervention, and which problems are systemic rather than site-specific.
The most consequential insight from studying high-performing field organizations is that the primary variable is not how many store visits a DM completes. It is how that DM’s time is actually distributed.
Gallup research identifies a clear threshold: when managers spend more than 40% of their time on individual contributor work, their capacity to deliver meaningful feedback, the primary driver of team engagement, is severely compromised. In the legacy model, the typical district manager was spending 40% to 60% of their time on hiring logistics alone during peak periods, before accounting for manual reporting, compliance administration, and travel overhead.
40%-60%
Share of DM time consumed by hiring logistics during peak periods in the legacy operating model
(Humanly)
High-performing field organizations have inverted this equation. Leading DMs in 2025 spend 60% or more of their time on coaching and performance development, with hiring, admin, and compliance each accounting for under 15% of their working week. That inversion has not happened because DMs became more disciplined. It has happened because organizations automated the work that was consuming them.
AI-assisted hiring screening reduces the time per hire from approximately two hours to 20 minutes, returning around 2,700 hours of field management capacity per 1,800 hires (Humanly). Real-time dashboards replace manual reporting cycles. Mobile execution tools eliminate the back-office administration that used to follow every store visit. The technology is not replacing the DM. It is returning the DM to the work only they can do.
How leading retailers are redesigning field leadership
The retailers demonstrating the strongest execution results have not simply upgraded their tools. They have made deliberate structural decisions about what the district manager role is for and what it is not.
Reducing complexity to restore capacity
Starbucks’ Back to Starbucks strategy, launched in late 2024 under CEO Brian Niccol, offers a clear example of this logic at scale. The company reduced menu complexity by 30% specifically to reduce the operational burden on store teams and free the capacity of field leaders for higher-value work. The strategic intent was explicit: simplify the operating environment so that district managers can act as experience orchestrators rather than operational troubleshooters. The precondition for redesigning the DM role was redesigning what the DM had to manage.
Consolidating execution into a single operating layer
Vans restructured its field execution model before peak season by replacing a fragmented, desktop-bound set of tools with a single mobile execution layer. The effect extended beyond DM efficiency. When execution became visible and simple, task ownership moved organically closer to the store floor. Accountability decentralized without additional process or mandate. The organizational structure followed the tool design. Michaels demonstrated the same principle from a data angle: by shifting to real-time execution visibility, the DM’s role changed from post-event reporter to proactive intervention leader. The smoothest peak season on record was the outcome of a data infrastructure decision, not a visit frequency change.
Treating the DM role as a strategic asset, not a coordination layer
The common thread in these examples is a deliberate decision by senior retail leadership to treat the district manager as a scarce, high-value resource whose time should be protected and directed, rather than a generalist layer that absorbs whatever the organization needs to push to the field. That distinction, between the DM as coordination layer and the DM as strategic asset, is the difference between organizations that are closing the execution gap and those that are not.
Where the district manager role is heading
The trajectory from the evidence available points toward a role that looks significantly different from the one most retail organizations still have today, even those that have begun the transition.
The most significant shift on the horizon is the embedding of agentic AI into field leadership workflows. AI tools are already being used to surface execution risks by identifying which stores are most likely to miss promotional compliance before it happens, allowing DMs to target their physical presence where it will have the most impact. By 2029, adoption of dynamic performance management, the model that replaces annual reviews with real-time, data-driven intervention, is projected to grow from 6% to 35% of organizations (Profit.co). The DM who spends their visit time reviewing last week’s data will be structurally disadvantaged against one who arrives knowing precisely what the store needs.
Remote visibility tools are reshaping the boundaries of the role. Computer vision and digital monitoring capabilities now give DMs inventory-level and staffing visibility across a store estate without physical presence. This does not replace the in-person visit. Gallup’s research is consistent that physical presence remains essential for the coaching and trust-building that drive genuine engagement. But it redefines when the physical visit is necessary, concentrating DM presence on situations where it will generate the highest return.
The organizational design question sitting under all of this is whether the district manager role will narrow or expand. The evidence from leading retailers suggests it will do both simultaneously. Administrative, coordination, and reporting functions will continue to be automated out of the role. Coaching, judgment, prioritization, and network-level performance ownership will grow. The DM of 2027 will carry a wider span of control than today, supported by better data and fewer administrative obligations, accountable for outcomes rather than activity.
The redesign is already underway
The district manager role is not in the early stages of a gradual evolution. For the retailers taking execution seriously, it is in the middle of a structural redesign that is changing the accountability model, the time allocation, the visit logic, and the organizational expectation of what a field leader is for.
The organizations still running the legacy model, fixed visit schedules, manual compliance reporting, and DMs buried in hiring logistics, are not just operating less efficiently. They are carrying an execution gap that their competitors are actively closing. The window to redesign proactively, before the gap becomes a competitive liability, is narrowing.
Store execution impacts every margin decision
Give frontline teams the tools, visibility, and guidance
to execute consistently across every location.
How is the district manager role changing in retail?
The district manager role is shifting from compliance auditor to performance orchestrator. The primary accountability is moving from standards inspection to team development and portfolio-level execution health. This is driven by expanded spans of control, rising execution costs, and the availability of real-time operational data that enables more targeted, higher-impact field interventions.
How are district manager store visits changing?
Store visits are becoming less frequent but more targeted. Fixed calendar schedules are giving way to risk-based models where visit allocation follows performance data. When a store’s execution metrics deteriorate, that triggers a visit. When performance is stable, remote monitoring and mobile task management reduce the need for physical presence. The visit itself has shifted from inspection to coaching-focused intervention.
Why are retailers redesigning how district managers spend their time?
The legacy DM operating model consumed significant management capacity in low-value administrative work, particularly hiring logistics, manual reporting, and coordination tasks. High-performing retail organizations have automated those functions to return DM time to the coaching and development work that actually drives store performance. The data is clear: when DMs spend more than 40% of their time on individual contributor tasks, their effectiveness as field leaders falls sharply (Gallup).
What does the future of the district manager role look like?
The role is moving toward what analysts are calling performance orchestration: a model where the DM uses AI-assisted data, remote visibility tools, and mobile execution platforms to manage a wider store portfolio with less administrative overhead and more coaching capacity. Physical store visits will remain essential, but they will be concentrated on situations where in-person leadership generates the highest return.
What is the retail execution gap and how does it affect district managers?
The retail execution gap refers to the difference between what headquarters intends and what actually happens in stores. Research puts the cost of this gap at $10 million to $40 million annually for large retailers. District managers sit at the center of closing it: they are responsible for the field layer between HQ strategy and store-level delivery. The redesign of the DM role is, fundamentally, a strategy for closing that gap more reliably and at lower cost.
Clothing Store: Male Visual Merchandising Professional Uses Tablet Computer To Create Collection. Fashionable Shop Sales Retail Manager Checks Stock. Small Business Owner Orders Stylish Items
Retail audit software replaces paper store audit forms with a digital system that captures store visit data in real time, assigns corrective actions automatically, and gives area managers and headquarters a live view of execution across every location.
Most retail organizations are not there yet. Area managers still walk stores with clipboards, then spend hours typing reports in their cars, only for findings to sit in spreadsheets no one acts on. In 2025–2026, that gap between headquarters strategy and what actually happens on the shop floor is no longer just an operational inconvenience. Delayed data, manual reporting, and hours spent re-entering information mean issues are identified too late to act on — after promotions have ended, after stockouts have already cost sales, and after compliance gaps have become repeat problems.
What is retail audit software?
Retail audit software is a digital tool that enables retailers to evaluate, document, and improve store execution across multiple locations. It replaces paper store audit forms with structured, mobile checklists that area managers, district managers, operations leaders, and compliance teams use during store visits to assess merchandising, operations, and standards compliance. By standardizing how visits are conducted and centralizing findings in one platform, it gives headquarters immediate visibility into what is happening across the store network and where action is needed.
A modern digital store visit app functions as an execution engine, connecting audit findings directly to corrective action. When an issue is identified, the software automatically assigns a task, sets a deadline, and tracks resolution in real time — replacing static reporting with a system built for action. Unlike spreadsheet-based processes where findings can take weeks to reach the right person, digital store visit tools enable teams to respond before the problem costs sales.
Why paper store audit forms are costing you more than you think
Paper-based store audits produce data that arrives too late to be useful. By the time a handwritten checklist is submitted, re-entered into a spreadsheet, and reviewed at headquarters, the findings are often weeks old. In fast-moving retail environments, that delay turns audits into historical records of failure rather than tools for improvement. Promotions have ended, shelves have been empty, and revenue has already been lost. For high-volume retailers, even a 1% execution gap can translate into millions of dollars in lost annual sales — and digital tools that address it reduce out-of-stock rates by 15–25%.
They also fail on consistency. Without mandatory photo evidence, GPS verification, or standardized scoring, audit results depend entirely on individual judgment. One area manager scores a store generously, another is strict about the same issues. When scores vary by person rather than by performance, cross-store benchmarking becomes unreliable and the decisions made from that data become harder to trust. Store managers who notice this quickly learn that the audit reflects who visited, not how the store is actually performing.
Then there is the hidden operational cost. Manual audits create a transcription burden that consumes up to 75% of field team time — hours that should be spent coaching store teams and improving execution on the shop floor, not re-entering data across systems.
Finally, paper audits break the link between insight and action. Issues are identified, written down, and reported, but without automated workflows they are rarely tracked through to resolution. Area managers are left chasing follow-ups manually, often across multiple stores, with no clear ownership or visibility. As a result, the same gaps appear visit after visit.
75%
of field team time consumed by manual data re-entry in paper-based audit processes
Source: Buyer’s guide industry research
This is what modern retail audit software is designed to fix.
What to look for in a retail audit software platform
Choosing the right retail audit software is not about digitizing your current process. It is about selecting a platform that drives consistent execution across every store and turns visits into measurable performance improvement. The key distinction is this: checklist tools capture information, while execution platforms turn that information into action. The capabilities below are what separate the two.
Mobile-first design with offline capability
Field teams do not work behind desks. They operate in stockrooms, basements, and large-format stores where connectivity is unreliable or unavailable. A mobile-first platform with full offline capability ensures audits can be completed without interruption, with data syncing automatically once a connection is restored. When this works well, adoption follows — retailers implementing mobile-first store visit tools see adoption rates reach as high as 95% among area managers within the first few months, ensuring the data captured actually reflects what is happening in stores.
Customizable, logic-branching forms
Audit forms should adapt to the reality of the store, not force area managers through irrelevant questions. Logic-branching forms use if-then flows to adjust dynamically based on previous answers, reducing audit fatigue and speeding up visits. More importantly, they standardize how audits are conducted across every location. When every manager follows the same structured logic, the data becomes comparable at scale — and comparable data is what makes regional benchmarking and performance management meaningful rather than misleading.
Automated corrective actions
This is what separates execution platforms from checklist tools. Every failed audit item should trigger an immediate, trackable action with a clear owner and deadline. Instead of findings sitting in reports, they are converted into tasks that can be monitored through to completion. This removes the need for manual follow-up and ensures issues are resolved, not just recorded. In practice, automating corrective actions reduces post-visit follow-up time by an average of 45 minutes per visit.
Photo and evidence capture
A credible audit needs proof, not opinion. Mandatory photo capture creates a system of record that makes audit findings defensible — particularly for visual merchandising compliance, promotional execution, and safety checks. Without it, store managers can and do challenge scores, inconsistencies emerge between regions, and trust in the audit process erodes. With photo evidence, both headquarters and store teams are working from the same objective view of what is actually happening in store. This is also the foundation of effective loss prevention: when product placement and store conditions are documented with images, patterns become visible that written reports miss entirely.
Real-time dashboards and cross-store visibility
Audit data should be available the moment it is captured. Real-time dashboards allow headquarters to track performance across stores, regions, and countries as visits happen, not weeks later. This enables teams to identify patterns early and act before issues escalate. When audit data is connected with sales or training data, it becomes possible to see exactly which execution gaps are impacting revenue — allowing teams to prioritize the fixes that matter most commercially rather than treating all compliance issues as equal.
Integration with your existing tech stack
The value of audit data increases significantly when it is connected to the rest of the business. Integration with POS, ERP, HR, and BI systems allows retailers to link execution data with sales performance, labor planning, and training outcomes. Consider what this makes possible: a regional manager sees that stores with lower audit scores also have lower conversion rates, and can immediately reprioritize visits and resources. A recurring compliance issue is traced back to a training gap and resolved at the root. API access and flexible data exports are table-stakes, but the real value lies in what connected data allows you to understand and act on.
Task management, communications, and training in one platform
The most advanced platforms go beyond audits entirely by connecting store visits to daily operations. When an area manager identifies an issue during a visit, a task is automatically assigned to the store team, a communication is sent to clarify expectations, and a relevant training module can be triggered to prevent the issue from recurring. The next visit then verifies whether the action was completed and the standard has improved. This is how retailers move from isolated audits to continuous execution improvement. Brands such as UNTUCKit have adopted this approach to align store teams, improve consistency, and ensure that every visit produces a measurable outcome rather than a filed report.
A comparison framework: how to evaluate retail audit software
At this stage, most buyers are not short of options — they are short of clarity. Multiple vendors claim similar capabilities, and without a structured framework, evaluation becomes subjective and slow. The five dimensions below give you a consistent way to compare platforms based on how they perform in real retail environments, not how they are positioned in sales materials.
Dimension
Key question to ask
Why it matters
Ease of use & adoption
Does it fit naturally into a store visit workflow?
~95% adoption within first few months when mobile-first
Reporting depth
Can you correlate audit scores with sales, training, and visit frequency?
Identifies which execution gaps are costing revenue vs. admin noise
Integration capabilities
Does it connect to POS, ERP, and BI systems?
Regional managers can link compliance scores to conversion rates
Scalability
Does it handle 200+ locations, multiple languages, and regional structures?
Template management and permissions must scale without complexity
Pricing transparency
Is total cost clear as you add stores, users, and functionality?
Opaque pricing signals opaque partnership
Ease of use and adoption is the first and most critical factor. If area managers do not use the tool consistently, the data cannot be trusted. The key question is how quickly the platform becomes part of the store visit routine. Adoption shows up in outcomes: one YOOBIC customer reduced store visit time by up to 90 minutes per visit after digitizing audits, freeing managers to spend that time coaching teams instead. If adoption stalls in even one region, network-wide performance data becomes distorted.
Reporting depth determines whether audit data can actually inform decisions. Basic tools generate static reports, but leading platforms allow you to analyze trends across stores, regions, and time periods. More importantly, they enable correlation — connecting audit scores to sales performance, training completion, and visit frequency. This is what allows operations leaders to identify which execution gaps are actually impacting revenue, and which are simply administrative noise.
Integration capabilities define whether audit data becomes useful beyond the audit itself. A disconnected tool limits insight to a single workflow. A connected platform allows a regional manager to see that stores with lower audit scores also have lower conversion rates, and to prioritize visits and resources accordingly.
Scalability becomes critical as soon as you move beyond a small store network. Many tools work well at 20 locations but struggle at 200 or more. What breaks first is typically template management, multi-language support, and regional permission structures. Lagardère Travel Retail operates across dozens of countries and store formats — maintaining consistency while adapting to local requirements at that scale requires infrastructure that most audit-only tools simply do not have.
Pricing transparency is not just about cost — it is a signal of how the vendor operates. If it is difficult to get a clear view of how costs increase as you add stores, users, or capabilities, that lack of transparency often carries through into the long-term partnership. Look for vendors who can clearly model total cost as the business grows.
Within this framework, YOOBIC is designed for retailers who need audit, execution, and frontline development to work as one system. Brands including Vans, Boots, and Lagardère Travel Retail use YOOBIC to manage store visits, daily execution, and frontline learning across large, complex store networks. The result is not just better audit data — it is more consistent execution across every location, measurable in compliance rates, coaching time, and commercial performance.
The ROI of replacing paper store audit forms
For a retailer with $1B in revenue, deploying a digital execution platform can deliver a payback period of just 7.8 months and an ROI of 265%, according to analysis by ToolsGroup. That return is driven by three factors: labor productivity recovered from eliminating manual processes, sales uplift from more consistent execution, and direct cost reduction across field operations.
7.8 months
average payback period for a $1B-revenue retailer deploying a digital execution platform — with ROI of 265%
Source: ToolsGroup industry analysis
Labor productivity is the fastest and most visible gain. Field teams save between 1.5–2.5 hours per day by eliminating manual data entry and report writing. That time is reinvested into higher-value activities on the shop floor. Claudie Pierlot reduced store visit time by up to 90 minutes per visit after digitizing audits. Lancôme saved 80 hours per week on store monitoring and eliminated more than 500 emails between field and headquarters every week. When that time is redirected into coaching and in-store execution, the impact extends beyond operational efficiency to improved store performance.
Lancôme — YOOBIC customer results
✓ 80 hours saved per week on store monitoring activities ✓ 500+ emails eliminated per week between field and HQ teams ✓ 9,000 field team reports completed annually
Claudie Pierlot — YOOBIC customer results
✓ Store visit time reduced by up to 90 minutes per visit ✓ Area managers reinvest time into coaching and best-practice sharing ✓ Recognized as a model for network-wide digitization
Sales execution improves because issues are identified and resolved before they impact revenue. Even a 1% execution gap can translate into millions of dollars in lost sales for large retailers. Digital audit tools reduce out-of-stock rates by 15–25%, ensuring products are available when customers are ready to buy. When audits are completed consistently and findings are acted on quickly, the downstream effect is fewer stockouts, stronger promotional compliance, and more reliable shelf standards. Boots increased daily check completion to over 80% after digitizing store processes, while Vitalia doubled promotional campaign completion by improving execution across stores.
15–25%
reduction in out-of-stock rates with digital audit tools
80%+
daily check completion at Boots after digitizing store processes
Cost reduction comes from eliminating inefficiencies across field operations. According to Coresight Research, 75% of retail decision-makers who adopted digital workplace technology reported moderate or substantial cost savings from introducing digital checklists, audits, and standard operating procedures. These savings extend beyond administration. Enabling remote audits and reducing unnecessary field travel generates significant reductions: based on YOOBIC customer data, 25 regional managers conducting remote audits saved $270,000 annually in travel costs alone.
$270,000
saved annually in field travel costs by 25 regional managers using remote digital audits
The question is not whether retail audit software delivers ROI. It is which platform will deliver it fastest and at scale.
Signs it is time to replace your paper store audit forms
Most retailers already know their store audit process is not working as well as it should. The question is whether the gap between knowing and acting is already costing more than the effort to change it.
If your area managers are still spending more time on admin than coaching — typing up reports after visits instead of working with store teams — and if audit findings are sitting in spreadsheets with no automated follow-up, the core issue is not visibility but action. The process identifies problems, but it does not resolve them.
When scoring standards vary by region and there is no photo evidence to validate what was actually found, the data cannot be trusted at scale. One store may appear compliant while another is penalized for the same issue, and without a system of proof, decisions are based on interpretation rather than reality.
If post-visit reports still take hours to compile and there is no real-time visibility into which stores have completed tasks, execution becomes reactive. By the time issues are reviewed, the opportunity to fix them has already passed.
If more than one of these reflects your current process, the gap is already measurable in lost time, missed sales, and inconsistent execution. The shift to retail audit software is not about replacing paper — it is about ensuring every store visit results in action, not just another document no one acts on.
How to implement retail audit software: a 90-day rollout plan
Most retailers can move from paper store audit forms to measurable execution improvement within 90 days. The fastest implementations follow a simple structure: configure for outcomes, test in real store conditions, then scale using data from the field rather than assumptions.
Phase 1: Configure
Design for outcomes, not paper. Define KPIs, build logic-driven templates, weight high-impact areas like merchandising and safety.
Phase 2: Pilot
Test in real conditions: run in 5–10 stores. Test offline use, photo upload speed, and corrective action resolution. Refine based on area manager feedback.
Phase 3: Scale
Roll out using data, not guesswork: train power users as champions. Use pilot data to identify regional gaps and outperforming stores. Cascade to the full network..
In the first 15 days, the focus is configuration. This is where many retailers go wrong by replicating their existing paper forms instead of redesigning audits around outcomes. The goal is not to digitize what you already do, but to define what actually drives performance — aligning on audit objectives, selecting the KPIs that matter commercially, and building templates that prioritize high-impact areas such as merchandising, availability, and compliance.
Between days 16 and 45, the priority shifts to pilot and iteration. Testing in 5 to 10 locations validates how the platform performs in real conditions. This stage should focus on three things: whether audits can be completed offline without friction, how quickly photos upload and sync, and how easily store teams can resolve assigned corrective actions. Feedback from area managers and store teams at this stage prevents problems at scale.
From day 46 to 90, the focus is scaling and adoption. Early data from the pilot highlights which regions require additional training, which templates need adjustment, and which stores are consistently outperforming. Training power users as internal champions accelerates rollout across the network. Retailers such as Vans have used this phased approach to deploy execution platforms ahead of peak trading periods, ensuring store teams are aligned and operational before demand is at its highest.
Retailers that follow this structure consistently begin to see measurable improvements within the first 90 days — not just in audit completion rates, but in execution consistency across stores. YOOBIC’s onboarding team supports each phase to ensure the platform is configured for real operational priorities, with measurable impact from the first rollout.
Ready to replace paper store audit forms?
The shift from paper store audit forms to digital execution is already happening, and the gap between retailers who have made the move and those who have not is widening. Every week spent on manual reporting, delayed data, and unresolved audit findings is a week where execution falls further behind. The question is not whether to replace paper store audit forms — it is how quickly your operation can start closing that gap. Book a demo to see how leading retailers are closing this gap.
Book a demo and find out how
Avoid wasted hours, blind spots and lost revenue with YOOBIC
Frequently asked questions about retail audit software
What is retail audit software?
Retail audit software is a digital system used to standardize and manage store audits across multiple locations. It replaces paper store audit forms with mobile workflows that capture data in real time, assign follow-up actions, and provide headquarters with visibility into store performance — helping retailers ensure consistent execution across their network.
What’s the difference between a store audit and a store visit?
A store audit is the structured evaluation of store performance against defined standards, such as merchandising, compliance, and operations. A store visit is the broader activity that includes the audit but also involves coaching, team engagement, and follow-up actions. Retail audit software connects the two, ensuring that every visit includes both assessment and improvement rather than just inspection.
What features should a digital store visit app for area managers include?
A digital store visit app should be designed to drive action, not just capture data. Mobile-first functionality with offline capability ensures audits can be completed anywhere. Logic-driven forms standardize how visits are conducted across regions. Automated corrective actions convert findings into tasks with clear ownership, preventing issues from being recorded but never resolved. Photo evidence creates a reliable, defensible record of execution. Together, these capabilities ensure that issues identified during visits are resolved quickly and consistently — not filed away.
How long does it take to replace paper store audit forms with digital tools?
Replacing paper store audit forms typically takes around 90 days using a structured phased rollout. Retailers often begin to see measurable improvements well within that window. For example, some have reduced store visit time by up to 90 minutes per visit after digitizing, allowing area managers to focus on coaching rather than reporting. Boots increased daily check completion to over 80% following digitization of store processes.
What ROI can I expect from retail audit software?
Retail audit software delivers ROI through labor savings, improved execution, and reduced operational costs. Field teams typically save 1.5–2.5 hours per day by eliminating manual reporting, while better execution reduces out-of-stock rates by 15–25%. Industry analysis by ToolsGroup shows that retailers can achieve payback in as little as 7.8 months, with ROI reaching 265% depending on scale and implementation.
When margins compress, most retail organizations reach for the same playbook. Prices go up. Headcount comes down. Store footprints shrink. These are understandable responses to genuine pressure, and in the short term, they can be defended on a spreadsheet.
But they have a ceiling.
UK retailers face £5.6 billion in additional operating costs in 2025–26, driven by wage legislation, employment taxes, and business rates (Retail Economics). The instinct is to absorb what you can, cut what you can, and pass the rest on to consumers who are already stretched. Most boardroom conversations about profitability are happening inside this frame.
The problem is that this frame has a documented failure mode.
£5.6 billion
Additional operating costs facing UK retailers in 2025–26, equivalent to 195,000 full-time jobs
Source: Retail Economics / YOOBIC, 2025
Why cost-cutting has a profitability ceiling
Cost reduction in retail is not a growth strategy. It is a defensive posture. At some point you have raised prices as far as customer tolerance allows and reduced labor as far as store performance can sustain. The retailers that continue to grow beyond that point are doing something different.
Research from Harvard Business Review identifies the mathematical consequence of understaffing directly: every additional minute of customer wait time reduces the probability of a purchase by approximately 5%. A store that saves $50,000 annually on payroll may be sacrificing $200,000 in abandoned purchases. The saving is real. The cost is invisible.
What happens when retailers tighten too hard
MIT Sloan’s research on retail performance describes a pattern that retail leaders recognize but rarely name. Pressure to protect margins leads to chronic understaffing and reduced investment in store operations. Service quality deteriorates. The store environment degrades. Footfall declines. That decline triggers further cuts. The cycle reinforces itself until the business is in structural decline.
This is not a hypothetical. It is the operating reality for a meaningful portion of the store closures recorded in the past three years. In 2024, store closures in the US increased 32% year-on-year (Bain, 2025). Not all of those closures were the result of market forces beyond a retailer’s control.
Insight
Retailers that treat cost-cutting as a margin strategy will eventually exhaust that lever. The ones protecting margin in 2026 are doing something harder: executing better.
What actually drives retail profitability at scale
The most significant margin opportunity in a large retail network is not on the cost line. It is in the gap between what headquarters plans and what actually happens inside stores.
This is not a soft, operational observation. It is a quantifiable financial claim. And the evidence for it is more robust than most retail leaders realize.
A retailer with 1,900 stores generating $1.2 million in revenue per store can unlock $11.4 million in incremental revenue from just a 0.5% improvement in execution performance, without opening a single new location or launching a new product (YOOBIC, 2025). The capital required is a fraction of what a traditional growth program demands. The speed of return is faster. And unlike cost-cutting, it does not erode the store environment or the teams that run it.
2.3x higher sales growth
Sales growth advantage for retailers using AI and ML to close execution gaps vs. those using manual methods
Source: IHL Group, cited in The Frontline Pivot report, 2025
What is the relationship between store execution and retail margin?
Store execution is the process by which headquarters strategy becomes store-floor reality. When promotions are set up correctly, when merchandising standards are followed, when tasks are completed on time and verified, the financial plan performs as modeled. When execution breaks down, even a fraction of that performance evaporates, repeated across hundreds of locations every day.
Retailers who have deployed AI and machine learning to measure and improve store-level execution are achieving sales growth 2.3 times higher and profit growth 2.5 times higher than those relying on manual oversight methods (IHL Group, 2025). That is not a marginal performance difference. It is a structural competitive gap that widens each year it is left unaddressed.
How much revenue is locked inside better execution?
The revenue upside from execution improvement is not theoretical. It is calculable from the compliance data most large retailers already hold, or could hold if they measured it properly.
For a grocery retailer operating 500 locations, a breakdown in execution across just 30% of stores results in more than $5 million in preventable annual losses: $3.9 million in missed promotional sales, $780,000 in lost vendor funding due to non-compliance, and $260,000 in revenue lost from uninformed associates (YOOBIC, 2025). That is a conservative model. For organizations operating at a larger scale, the figure reaches eight figures.
Why most retail leaders overestimate how well their stores are performing
Most retail organizations measure whether instructions were sent, not whether they were executed correctly. The result is a consistent and significant gap between perceived and actual compliance levels.
When retail COOs and heads of store operations are asked about promotional compliance, the typical answer is 80–85%. When retailers implement structured measurement, including photographic audits and mystery shopping programs, actual compliance consistently falls between 55% and 65% (BCG, Wharton, 2025). That is a 15–25 percentage point gap between what leaders believe is happening and what is actually happening on the store floor.
Closing that gap does not require a major transformation program. It requires a shift in what gets measured, and the systems to measure it.
DEFINITION:
Execution-led profitability
The revenue and margin improvement achieved when stores consistently execute headquarters plans. Expressed as a measurable financial outcome rather than an operational metric, execution-led profitability treats store-level task completion, promotional compliance, and merchandising accuracy as direct drivers of the P&L.
The three places your margin is quietly disappearing
Execution failure does not show up as a single line item. It distributes itself across the business in ways that look like separate problems but share a common cause. Understanding these three categories is the first step toward treating frontline execution as a financial priority rather than an operational one.
Why most out-of-stocks are an execution problem, not a supply chain problem
Out-of-stocks are widely understood to be a supply chain challenge. The data tells a different story. Between 70% and 90% of out-of-stock incidents are caused not by supplier or logistics failures, but by failures in in-store replenishment processes (PullLogic / IHL Group, 2025). The product is in the building. It is sitting in the stockroom or misplaced on the wrong shelf. Execution is the problem.
Global losses from inventory distortion, which includes out-of-stocks, overstocks, and shrinkage, are projected to reach $1.77 trillion annually. Out-of-stocks alone account for $1.2 trillion of that figure. In many leading retail chains, system inventory levels differ from physical inventory by more than 35%, creating blind spots that prevent automated replenishment systems from triggering correctly (Harvard Business School, 2025).
The downstream consequence is significant. Nearly one in twelve products is unavailable to buyers at any given time, leading to a 32% rate of brand switching when a customer encounters an empty shelf (PullLogic, 2025). That is not a supply chain problem. It is an execution problem with a supply chain label.
70–90%
Out-of-stocks caused by in-store replenishment failures, not supply chain or supplier issues
Source: PullLogic / IHL Group, cited in The Frontline Pivot report, 2025
How visual merchandising failures cost retailers billions every year
Poor visual merchandising cost US retailers $125 billion in lost sales over a recent twelve-month period, representing approximately 3.3% of the entire physical retail market (40Visuals / CSP Daily News, 2025). This loss is consistent across luxury, mid-market, and discount segments. It is not a problem isolated to a particular format or price point.
Consumer tolerance for in-store friction has reached a historic low. Approximately 50% of consumers report leaving a store without making a purchase because of poor visual merchandising. Only 51% are likely to return after that experience. The primary frustration, cited by 33% of shoppers, is hard-to-find products: a direct consequence of execution failure at the store level.
This is not a design problem. Planograms exist. Brand standards exist. The gap between the standard and the shelf is an execution problem.
What is the Slowness Tax and how does it erode retail revenue?
The Slowness Tax is the revenue cost of delayed execution. Research from West Monroe identifies it as eroding up to 5% of annual revenue across organizations where decision-making is slow (West Monroe, 2025). In retail, this manifests as the gap between when an operational problem is identified and when corrective action reaches the store floor.
The causes are structural. When a promotion compliance issue is detected through a field audit, the information travels back to headquarters, gets analyzed, escalates through approval layers, and eventually results in an instruction that has to travel back down to the store. By the time action is taken, the promotional window may have passed. The opportunity is gone.
In an industry where responding to a cultural moment, a competitor price change, or a supply constraint within hours can determine whether a week’s margin is protected or lost, decision latency is not a soft organizational issue. It is a measurable operating cost.
Profit drain category
Estimated annual cost
Root cause
Inventory distortion (global)
$1.75 trillion
In-store replenishment failure (70–90% of OOS)
Visual merchandising failures (US)
$125 billion
Execution breakdown at store level
Decision latency (Slowness Tax)
Up to 5% of annual revenue
Fragmented systems and approval layers
Source: PullLogic / IHL Group; 40Visuals / CSP Daily News; West Monroe, all 2025.
Why execution failure is so hard to see from headquarters
Understanding that execution failure costs money is one thing. Understanding why it persists, across organizations with experienced leadership and significant investment in operational tools, requires a harder look at how most retail businesses are actually run.
The systems designed to manage store operations in most large retail organizations were built for a different era. They were designed for a smaller, slower, less complex operating environment. They were not designed for a mobile-first workforce turning over at 60–80% annually, operating across hundreds of locations, receiving instructions through email.
Why retail leaders overestimate store compliance
The perception-reality compliance gap is not the result of poor leadership. It is the result of measuring the wrong thing. Most retail organizations track whether instructions were sent, whether messages were opened, whether a manager acknowledged receipt. None of those signals confirm execution.
Headquarters-to-frontline email open rates average 20–30% (YOOBIC, 2025). The associate responsible for executing a promotion may never have read the instructions. By the time a field audit or mystery shopping program surfaces the compliance failure, the promotional window may be closed. The vendor funding is already at risk.
What is decision latency and why does it compound execution failure?
Decision latency is the measurable gap between recognizing an operational problem and taking effective action at store level. In retail, it manifests across four distinct stages, each of which adds delay and reduces the organization’s ability to respond.
FRAMEWORK: The four forms of decision latency in retail
1 Informational latency: The time required to collect and reconcile data from fragmented systems. Without a shared operational view, leaders cannot identify the problem.
2 Analysis latency: The delay caused by unclear ownership or the need for multi-functional alignment on what the data means and what action is required.
3 Authorization latency: The bottleneck created by excessive approval layers and rigid hierarchies that prevent rapid response to store-level issues.
4 Action latency: The gap between the decision and execution at store level, caused by outdated communication tools or unclear task delivery.
Source: West Monroe, 2025; The Frontline Pivot report, 2025.
Each form of latency adds time to the response cycle. Together, they mean that execution problems identified on Monday may not be corrected until the following week, if at all. In a promotional environment where a missed compliance window directly translates into lost vendor funding, the financial cost of that delay is not abstract.
How workforce turnover creates a persistent execution gap
Retail has some of the highest workforce turnover of any industry. Annual turnover exceeds 60% across the sector and surpasses 80% in convenience retail (The Frontline Pivot report, 2025). A new associate typically requires 6–10 weeks to reach full productivity, during which they operate at 60–70% of the effectiveness of an experienced team member.
In high-turnover environments, a significant portion of the workforce is always in this ramp phase. Execution quality fluctuates constantly. Standards that experienced associates follow by habit have to be relearned by new hires who are receiving instructions through the same email chains and paper-based systems their predecessors found inadequate.
Frontline employees lose 15–25% of their working time to operational friction: searching for information, seeking clarification on unclear instructions, and repeating tasks executed incorrectly the first time (YOOBIC, 2025). That is not a people problem. It is a systems problem.
The retailers closing the gap, and what they’re doing differently
The strongest evidence that execution-led profitability is real, and not a theoretical framework, comes from the financial performance of retailers who have committed to it. The approaches differ. The underlying logic is the same: consistent store-level execution is a direct driver of margin, and the organizations that treat it as such outperform those that do not.
How Zara uses frontline data to protect margin at scale
Zara’s financial performance is well understood. What is less often examined is the mechanism behind it. The brand achieves an 85% full-price sales rate, compared to an industry average of 60–65%. It turns inventory 10–12 times per year, roughly triple the industry average of 3–4 turns (The Frontline Pivot report, 2025). These metrics are not the result of superior product design or marketing spend. Zara’s marketing budget is 0.3% of sales, compared to an industry average of 3%.
The mechanism is frontline intelligence. Store managers at Zara provide daily reports that go beyond sales figures to capture customer requests, trends, and even items customers try on but do not buy. This real-time data flows back to designers who can bring a new concept from runway to store floor in as little as 15 days. By producing in small batches and replenishing stores twice a week, inventory is always aligned with actual demand rather than six-month-old forecasts.
The store floor is not a distribution endpoint. It is a data collection hub. The financial results follow directly from that.
What execution-led growth looks like in practice
Uniqlo’s performance between FY2022 and FY2024 offers a different but equally instructive example. Revenue grew 40% over that period. Total inventory declined slightly. The product shortage rate dropped from 3% to 2% (The Frontline Pivot report, 2025). Profitability improved while inventory investment fell.
This was achieved through the company’s ‘Zen-in Keiei’ philosophy, which treats every store as an independent business unit and every associate as a business leader. Digital tools including RFID and self-checkout were deployed not to replace workers but to remove unnecessary processes, freeing associates to focus on service and product education.
Retailers using AI and ML frameworks for store operations reported approximately 8% annual profit growth in 2023 and 2024, significantly outperforming peers still relying on manual methods (The Frontline Pivot report, 2025). Pilot Company achieved a 95% task completion rate across more than 900 locations using a structured frontline operations platform, up from a baseline that reflected the fragmented communication patterns common across large retail networks.
8% annual profit growth
Profit growth advantage for retailers using AI and ML frameworks for store operations vs. manual-method peers
Source: Articsledge, cited in The Frontline Pivot report, 2025
How do retailers move from broadcast communication to structured execution?
The operational shift that characterizes execution-led retailers is consistent across formats and geographies: replacing broadcast communication with structured, role-based task delivery; replacing delayed audit-based visibility with real-time performance data; and replacing informal confirmation with verified task completion.
Replacing email-based communications with role-based, mobile-first delivery can increase frontline engagement by 60–80% (YOOBIC, 2025). That engagement improvement is not an end in itself. It is a precondition for the execution consistency that drives the financial outcomes above.
Accelerated via mobile-first training and task guidance
Financial outcome
15–25 percentage point compliance gap vs. perceived
Execution improvement unlocks $10M–$40M in annual value
Source: YOOBIC, 2025; BCG; The Frontline Pivot report, 2025.
What retail leaders need to rethink about store operations
The mental model shift required here is not primarily technological. It is financial. Organizations that continue to classify frontline operations as a cost center to be managed will make investment decisions that optimize for short-term savings at the expense of long-term margin. Those that reclassify it as a revenue-generating capability will fund it, measure it, and manage it accordingly.
The IHL Group’s research on the ‘End of Good Enough’ era in retail operations documents a clear bifurcation: profit winners in 2025 are prioritizing inventory visibility 208% higher than profit laggards. For every dollar a mid-market retailer spends on operational technology, Tier 1 competitors are spending two (IHL Group, 2025). That investment gap does not stay constant. It widens year by year into a structural advantage that is increasingly difficult to close.
What does treating frontline operations as a profit lever actually require?
The practical requirements are more tractable than most organizations assume. They do not require wholesale infrastructure replacement. They require a sequence of deliberate changes to how store operations are measured, communicated, and verified.
From cost center to profit lever: three operational shifts
1 Measure execution as a financial metric. Track promotional compliance, task completion rates, and merchandising accuracy as P&L inputs. The perception-reality compliance gap is not visible until it is measured. Closing a 25-percentage-point gap can unlock $10M–$40M in annual value for large organizations (BCG, 2025).
2 Replace broadcast communication with structured task delivery. Role-based, mobile-first communication with read confirmation and task verification replaces the email chains that reach 20–30% of the intended audience. This is the prerequisite for consistent execution at scale.
3 Build real-time visibility into store performance. Shifting from delayed audit reporting to live execution dashboards gives district managers and operations leaders the ability to identify and correct compliance failures before they become financial losses.
How do retailers build an execution-led operating model?
Retailers moving to task-based labor models, where labor allocation is defined by the specific tasks that need to be completed rather than by filling static schedule slots, can achieve store labor savings of up to 25% over five years, while simultaneously improving execution quality (Kearney, 2025). This is the inverse of the cost-cutting model: efficiency achieved through better organization of work rather than through reduction of the workforce.
The distinction matters because the cost-cutting model has a ceiling. The execution-led model does not. As task completion rates improve and execution variability decreases, the financial returns from the same investment grow. Every percentage point of compliance improvement compounds across the network.
What is the financial case for investing in store operations technology?
The financial case is built on two numbers. The first is the size of the compliance gap between what leaders believe their stores are achieving and what structured measurement reveals. The second is the revenue value of closing that gap.
For most large retail organizations, the answer to both questions makes the investment case straightforward. The $10M–$40M figure cited by Boston Consulting Group for the annual value destroyed by execution failure is not a ceiling. It is a floor. Organizations that begin measuring their actual compliance levels for the first time frequently discover that the opportunity is larger than that.
The retailers that will build durable profitability in 2026 are those that have stopped treating the store floor as the place where strategy arrives, and started treating it as the place where profitability is determined.
Insight
The retailers that will protect margin in 2026 are not the ones cutting hardest. They are the ones executing most consistently. Frontline operations are not a cost to be managed. They are a profit lever to be activated.
Book a demo and find out how
Avoid wasted hours, blind spots
and lost revenue with YOOBIC
Zara’s famous feedback loop is real. But it is the visible output of a system most retailers have never built — not the system itself. The real competitive variable is signal-to-decision latency: the interval between a store team observing something on the shop floor and that observation influencing a central decision. Inditex has compressed that interval to hours through four interdependent mechanisms. Most retailers have not. This article explains what those mechanisms are, why they are hard to replicate, what operations leaders can realistically do about it, and what the next generation of retail operational precision should actually optimize for.
Every retailer wants to be Zara.
A Zara store manager notices a jacket selling out on a Tuesday. By the weekend, more are on the way. That loop is the entire business model.
Except it is not. Not quite.
Inditex, Zara’s parent company, reported net sales of €39.9 billion in FY2025 with a gross margin of 58.3% (Inditex FY2025 Results). On Zara’s fashion floor, inventory turns roughly 12 times per year. Among major fashion retailers, industry benchmarks show turnover rates ranging from 2.8x to 4.3x annually — a gap that reflects fundamentally different approaches to inventory commitment (Architecture of Agility, section 2.2; GuruFocus FY2024; Macrotrends FY2024).
The gap is striking. But the explanation most people land on — the feedback loop — only describes what you can see from the outside. The part that actually makes it work is much harder to spot, much older, and much more difficult to copy.
“The Zara story is not outdated — it is oversimplified. The feedback loop is real. The problem is that most retailers who try to replicate it focus almost entirely on the loop itself, and not on the infrastructure required to make it function.”
Fabrice Haiat, CEO of YOOBIC
MYTH
REALITY
Zara is fast because its store managers report demand back to headquarters quickly.
Zara is fast because the system is already ready to act before the signal arrives. The feedback loop is the output. The supply chain architecture is the engine.
Signal-to-decision latency: the concept that explains everything
The governing concept in the Inditex model is not the feedback loop. It is signal-to-decision latency: the interval between a store team observing something on the shop floor and that observation influencing a central decision.
Inditex has compressed that interval to hours or days. In many traditional retail networks, the honest answer is weeks — or the signal never arrives at all, because no structured channel exists to carry it.
That gap is not primarily a technology problem. Retailers have been investing in dashboards, RFID, and data platforms for years. Many have excellent visibility. The constraint is not what they can see. It is the organizational and supply chain architecture that determines how fast they can act on what they see.
Many retailers already have access to operational data, but struggle to connect those insights to real-time execution in stores.
Every mechanism in the Inditex model exists to compress this interval. Proximity sourcing reduces the physical lead time. Pre-positioned materials eliminate waiting for fabric. Reserved factory capacity means production can respond without displacing other orders. Distributed decision rights mean the observation does not have to travel through layers of approval before it influences what happens next.
These are not four separate advantages. They are four components of a single system designed around one governing idea: get the signal from the store to the decision as fast as possible, and make sure the system is ready to act on it when it arrives.
The feedback loop is real. The explanation most people give is not.
The standard version of the Zara story describes store managers observing what customers are buying, that data flowing back to the design team, and new product arriving within days. It is a compelling description of organizational responsiveness.
It is also, as a standalone explanation, significantly incomplete.
The narrative almost never addresses the most fundamental constraint: upstream readiness. If Fabric is sitting in a warehouse in East Asia with a six-week lead time, no volume of fast data will put new inventory on the shelf by Saturday. The speed of the loop depends entirely on the state of the system it feeds into.
That readiness does not happen by accident. It is the result of deliberate decisions made months and years before any store manager notices a trend. Inditex builds it through a practice known as postponement: rather than committing to final designs early, the company purchases vast quantities of undyed, unfinished fabric in advance. When a trend signal arrives from the store floor, that fabric can be dyed, cut, and finished within hours. The commitment to production is delayed until demand is actually confirmed (Architecture of Agility, section 4.2).
Traditional retailers often commit 80% to 100% of their seasonal inventory before a single unit is sold. Inditex commits roughly 15% to 25% in advance, holding the remainder of production capacity uncommitted and available to respond to actual demand (Architecture of Agility, section 2.2).
Why Zara store managers shape production decisions, not just floor plans
The organizational dimension is equally critical. Zara store managers use handheld devices not only to track inventory, but to feed qualitative intelligence directly to design teams: what customers are requesting, what detail on a product prompted a question, what silhouette they came in looking for but did not find. This is not automated POS data. It is human observation, structured and channeled upstream (Architecture of Agility, section 5.1).
Traditional retail treats stores as distribution endpoints. Corporate sets direction. Stores execute. Information flows one way: down. Zara flipped it. The store became a sensing mechanism. Qualitative intelligence flows up, decisions flow down, and the loop continues — continuously.
Inditex’s commercial team sits in an open-plan workspace in Arteixo, where designers, commercial staff, and production planners work within physical proximity of each other. Decisions that in other organizations would require scheduled meetings and formal sign-off happen through conversation, often within minutes of a store signal arriving (Architecture of Agility, section 5.2).
What I think most retailers underestimate is not the speed of the signal itself, but the organizational ability to act on it. Digitizing visibility without redistributing decision authority produces faster documentation of missed sales, not faster recovery from them.
The four mechanisms that compress the interval
Zara’s speed is not a single capability. It is an emergent property of four interdependent mechanisms, each of which directly compresses signal-to-decision latency. Understanding them separately is useful. Understanding how they function together is what makes the model legible.
Proximity sourcing: manufacturing close to demand, not where it is cheapest
Roughly 50% to 60% of Inditex’s fashion-sensitive production is manufactured in proximity clusters in Spain, Portugal, Turkey, and Morocco, where lead times from concept to distribution center run 10 to 15 days. Only lower-risk, higher-volume basics are produced in Asia, where lead times extend to 3 to 6 months. Proximity production costs more per unit, but it allows Inditex to convert a confirmed demand signal into finished product faster than any fully outsourced model can match. The margin is recaptured through full-price sell-through rather than end-of-season clearance. (Architecture of Agility, section 4.1)
How this compresses the interval: Physical geography sets the floor on how fast a signal can become product. Proximity sourcing moves that floor from months to days.
Pre-positioned materials: the greige fabric strategy
Inditex purchases undyed fabric in large quantities before any specific designs are finalized. Because the core material is already in the warehouse and already paid for, it can be converted into any color or pattern within hours of a confirmed demand signal. The 48-hour response window supply chain commentators often cite is not a data achievement. It is a materials strategy. The signal moves quickly because the factory was already loaded before it arrived. (Architecture of Agility, section 4.2)
How this compresses the interval: Pre-positioned fabric eliminates the waiting time between signal and material availability, turning a weeks-long procurement step into a same-day production decision.
Reserved factory capacity: treating unused capacity as a strategic asset
Most retail supply chains are optimized for efficiency — running factory capacity as close to 100% utilization as possible. Inditex takes the opposite position. Proximity factories operate at approximately 4.5 days per week in standard periods, holding reserve capacity available for surge demand. A trending item does not have to wait in a production queue behind other orders. The factory can absorb a rapid-response request without displacing existing commitments. Slack, in this model, is not waste. It is optionality. (Architecture of Agility, section 4.3)
How this compresses the interval: Reserved capacity means the response to a store signal is not delayed by a full production queue. The factory can absorb the request the same week.
Distributed decision rights: stores as intelligence sources, not execution endpoints
Store managers at Inditex have meaningful authority over what information reaches the design and commercial teams, and meaningful influence over replenishment decisions. They are not just completing checklists. They are feeding a sensing system. The store visit, the task completion record, and the structured observation are not administrative processes. They are the mechanism by which frontline intelligence either reaches operations or disappears into a weekly report no one reads before the information is stale. (Architecture of Agility, sections 5.1–5.2)
How this compresses the interval: Distributed decision rights remove the organizational layers between observation and action. The signal does not wait for a meeting. It reaches the decision-maker the same day.
The cumulative effect of all four mechanisms is visible in the performance data:
Performance metric
Zara (fashion track)
Traditional retailer
Design to shelf
10–15 days
6–9 months
Replenishment cycle
Twice weekly
Seasonal
Inventory age
~30 days
~150+ days
Markdown velocity
~15% of styles
40–50% of styles
Pre-season commitment
15–25% of range
80–100% of range
Signal-to-decision latency
Hours or days
Weeks or months
Source: Architecture of Agility, section 8; Inditex FY2025 Results
Why data investment alone cannot close this gap
A retailer can invest heavily in RFID, real-time dashboards, and forecasting tools, and still find that its lead times remain stubbornly long. The reason is that data and decision rights are not the same thing.
Zara achieves approximately 99% inventory accuracy through RFID, compared to an industry average below 70% (Architecture of Agility, section 6.1). That accuracy gives store teams and central operations near-perfect visibility into what is moving, what is not, and where stock sits at any moment.
But high inventory accuracy tells you that a trending item is out of stock. It does not restock it faster if the supply chain is locked into long-term contracts with suppliers operating on 16-week lead times. In that situation, real-time data is, in effect, a very precise record of missed sales.
This is the visibility-action gap: many retailers have digitized their visibility without changing who holds the authority to act on what that visibility reveals. Data moves fast. Decisions do not. The result is a system that is highly informed and structurally slow at the same time.
Factor
Centralized retail model
Inditex / Zara model
Inventory accuracy
Below 70% (industry avg)
~99% via RFID
Decision-making structure
Filtered through HQ approvals
Distributed to store level
Response to a trend signal
Processed in regional cycles
Store manager flags same day
Production flexibility
Up to 100% committed in advance
75%+ capacity held uncommitted
Store manager role
Display and task executor
Commercial sensor and intelligence source
Signal-to-decision latency
Weeks or months
Hours or days
Sources: Architecture of Agility, sections 2.2 and 6.1; Inditex FY2025 Results
Why most retailers face structural barriers to replicating this model
Understanding the Inditex model is one thing. Replicating it is another. The barriers are real, structural, and in some cases, fundamental to how most retail businesses are organized and financed.
Supply chain geography sets the ceiling on retail speed
Inditex built its proximity sourcing network over decades. It is the anchor tenant for more than 1,800 suppliers, which gives it leverage to demand priority production windows that most brands cannot access (Architecture of Agility, section 7.2). A retailer with 16-week lead time agreements embedded in its supplier contracts faces a structural ceiling on responsiveness that no data platform can raise.
The instinct many retailers have is to close that gap with better technology. But the diagnosis is wrong. Long lead time agreements make rapid response structurally impossible regardless of how good the data is. The constraint is not visibility. It is geography, contract terms, and the supplier relationships that underpin both.
The organizational design problem: push culture vs. pull culture
Traditional retail operates on a push model. Headquarters decides. Stores execute. Information flows one way. Moving to a pull model — where store-level observations actively shape central decisions — requires redistributing real authority to the store floor, which is a significant cultural and structural change for most organizations.
In matrix-structured organizations with layered approval processes, the informal, rapid decision-making that characterizes the Arteixo model is, as the Architecture of Agility report puts it, “culturally alien” (section 7.3). That is not a criticism. It is an accurate description of how most large retail operations are designed to function at scale.
One important nuance on the inventory numbers
The 12x inventory turnover figure is frequently cited without context. That number reflects Zara’s fashion floor specifically, where the rapid-response model operates at full intensity. At the consolidated Inditex group level — which includes all eight brands, raw material buffers, and slower-moving basics — the financial inventory turnover rate is approximately 5.1x per year. That figure is still exceptional: most competitors benchmark below 3x. But the distinction matters. Replicating the 12x number in isolation, without the four mechanisms behind it, is not a meaningful goal. Replicating the logic of the system is.
What operations leaders can realistically do without rebuilding their supply chain
Most operations leaders reading this do not own their supply chain and cannot replicate these mechanics directly. That is an honest constraint, and it is worth naming explicitly before moving to what is actually within reach.
The underlying design principle is more transferable than the specific mechanics. Design your system so that the people closest to demand have both the channel and the authority to influence what happens next. The store visit, the task completion record, and the structured checklist are not administrative tools in this context. They are the mechanism by which frontline observation either becomes operational intelligence or disappears into a weekly report that no one reads before the information is stale.
Centralized data without hyper-local execution authority is documentation. Execution without centralized data is inconsistency. The Inditex model achieves both — and that combination is what creates the performance gap, not the feedback loop on its own.
The store is not a distribution endpoint. It is the best demand sensor you have.
Zara did not become Zara by implementing better dashboards. It became Zara by designing an organization in which the people closest to customers had both the tools and the authority to make that proximity count. The feedback loop is the result of that design. It is not the design itself.
For operations leaders outside the Inditex model, the question is not whether you can replicate all four mechanisms. Most cannot, and that is an honest answer. The question is whether your store teams are functioning as sensors or just as executors. And if the answer is the latter, no amount of additional reporting will change what your organization is structurally capable of.
What should the next generation of retail operational precision optimize for?
There is one dimension that rarely appears in commentary about Zara, and it is the most important one to address honestly.
The Inditex model generates approximately 11,000 styles per year across its brands. Artificial scarcity drives urgency. Urgency drives purchase. Purchase drives returns. The system that makes Zara operationally exceptional is also the system that places significant pressure on supplier labor conditions, generates overproduction at the industry level, and contributes to a waste problem that retail has not yet solved.
That tension is worth naming directly. If it is possible to engineer this level of precision around speed and inventory responsiveness, the same organizational rigor — the same compressed signal-to-decision latency — could in principle be applied to different outcomes entirely: reducing overproduction, improving markdown efficiency, shortening returns cycles, and optimizing supplier conditions in response to real-time data.
Some retailers are beginning to move in this direction. Using inventory intelligence not just to chase demand, but to reduce it where demand is speculative. Using store-level observation not just to restock faster, but to identify what should not have been produced in the first place. Using the feedback loop not just as a commercial instrument, but as a sustainability one.
The next competitive edge in retail will not simply be speed. It will be the ability to apply the same operational precision that Inditex built around responsiveness to a new set of outcomes: waste reduction, markdown elimination, inventory exposure management, and supplier impact. The organizations that figure out how to compress the signal-to-decision interval around those problems — not just around sell-through — will be the ones that define the next decade of retail operational excellence.
Zara showed the industry what a system optimized for speed looks like. The more interesting question now is what a system optimized for both responsiveness and responsibility would look like. That is not a softer version of Zara’s model. It is a harder one.
Zara operating model: summary
Governing concept
Signal-to-decision latency — compressing the interval between store observation and central action
Mechanism 1
Proximity sourcing: 50–60% of fashion production in Europe/North Africa, 10–15 day lead times
Mechanism 2
Postponement: pre-positioned greige fabric held uncommitted until demand is confirmed
Mechanism 3
Reserved capacity: proximity factories at ~4.5 days/week; surge capacity held idle
Mechanism 4
Distributed decision rights: store managers authorized to feed qualitative intelligence upstream
Inventory turnover
~12x/year (Zara fashion floor); ~5.1x (Inditex group level)
Every week, retail leaders make decisions based on compliance numbers that are wrong. Not slightly off — materially wrong. They approve vendor funding, set regional targets, and sign off on campaign performance based on data that hasn’t been independently verified. When the numbers finally catch up with reality, it’s too late to recover the promotion, the quarter, or the margin.
This is what the retail industry’s $1.77 trillion annual inventory distortion bill actually represents. Not bad luck. Not supply chain complexity. The accumulation of operational failures that were never measured accurately enough to prevent.
$1.77 trillion
Annual global cost of inventory distortion
IHL Group, Equivalent of 6.5% of total global retail sales
The root cause is a specific and measurable gap between what retail leaders believe is happening across their store network and what structured, independent verification consistently reveals. Leaders typically assume 80% to 85% promotional compliance. When photo-validated digital audits replace that assumption, actual rates land between 55% and 65%.
That is not a rounding error. A 20-point compliance gap across 500 stores means roughly 100 stores are executing incorrectly at any given time. For a retailer running a promotional program with $10 million in expected revenue uplift, that gap can erase a third of it before the campaign window closes.
The two businesses that illustrate this most directly are Michaels and Pilot Flying J. At Michaels, switching to structured digital audit workflows across 1,350 stores meant their SVP of Store Operations could pull up live execution data — by store, by district, validated with photo evidence — in seconds during a board session. They were no longer managing their assumptions. They were managing their stores.
At Pilot Flying J, the before-and-after was even starker. Before structured digital audits, regional managers had no reliable visibility into shift readiness across 900+ locations. After deployment, compliance visibility across the entire network went from effectively zero to 95%. No changes to standards, no additional staff. Better measurement.
The rest of this guide explains how to build a retail audit program that produces that kind of operationally trustworthy data — and what happens to the business when you do.
2. What is a retail audit?
A retail audit is a structured, standardized evaluation of a store’s performance against defined brand, operational, or regulatory standards. Its purpose is to produce verified, comparable evidence of what is happening on the sales floor — not to direct what should happen next.
Definition: retail audit
A retail audit is a formal, evidence-based assessment of a store’s compliance with brand, operational, and regulatory standards. It uses standardized criteria, consistent scoring, and photo-verified evidence to produce an objective, benchmarkable record of execution quality across a store network. The output is data, not action.
A store visit is the physical event. The audit is the instrument used during it. Not every store visit is an audit, an informal walkthrough or a one-to-one coaching conversation is not an audit. A retail audit requires a predefined standard, a structured assessment, documented evidence, and a scored output that can be compared consistently across locations and over time.
Everything that happens in response to that output — task assignment, corrective action, training, coaching — belongs to separate operational systems. When those functions are built into the audit itself, the measurement is compromised. The person auditing should have no stake in the outcome of the response.
The compliance perception gap — why the industry is flying blind
There is a number that most retail organizations have never calculated: the distance between their assumed compliance rate and their actual one. It is the single most commercially important gap in retail operations, and almost no one is measuring it.
15–25 percentage points
The compliance perception gap. Leaders assume 80–85% compliance.
This gap is not caused by underperforming store teams. It is caused by organizations that measure whether instructions were sent, not whether they were executed correctly. When Canada Goose moved from informal VM inspection and emailed PDFs to photo-validated digital missions, they discovered that feedback loops they assumed were two weeks were collapsing the same morning — and that what they thought they knew about execution accuracy across their global estate was based on assumption, not evidence.
That moment of discovery is uncomfortable. It is also the most important data point a retail operations leader can have.
3. Retail audit taxonomy: the five types and what each one measures
There are five main types of retail audit, each designed to measure something different. The most common source of wasted field time in retail is using the wrong audit type for the wrong objective — and generating data that no one can act on because it answers the wrong question.
Audit type
What it measures
Methodology
Primary output
Compliance audit
Adherence to brand, operational, and regulatory standards
Daily process adherence, SOP completion, store readiness
Structured checklist-based observation
Completion record, variance flags
Mystery shopping
Customer experience as received, not as intended
Covert, qualitative, perception-based
Perception score, qualitative narrative
Remote / virtual audit
Execution consistency between in-person visits
Photo or video submission, guided self-assessment
Digital completion record, trend data
Compliance audit — the operational sensor
A compliance audit measures whether a store is meeting the standards it is supposed to meet. It is overt, scored, and conducted against a predefined rubric. Its commercial purpose is to produce a consistent, photo-verified record that headquarters can use to distinguish isolated underperformance from a systemic failure spreading across the network.
Bang & Olufsen audits 400 stores across Europe, the US, and APAC against a unified premium standard. Without that measurement infrastructure, any variance in the in-store experience is invisible until it shows up in NPS or sales data — at which point the brand damage is already done.
Merchandising audit — the revenue sensor
A merchandising audit measures whether the shelf reflects what it is supposed to reflect: the right products, in the right positions, priced correctly, displaying current promotional materials. Poor promotional execution can reduce the revenue impact of a campaign by up to 20%. For large retailers running simultaneous promotions across hundreds of locations, that loss compounds fast and rarely surfaces until the window has closed.
Vans experienced this directly. Managing display execution across 450 stores spanning Vans, Timberland, and The North Face through SharePoint and fragmented photo repositories made consistent measurement structurally impossible. Vans’ transition to standardized photo validation shows how quickly merchandising visibility can change at scale. Moving to standardized mobile photo validation meant HQ could verify floor-set compliance estate-wide for the first time — not during a field visit, but in near-real time.
Remote and virtual audit — continuous measurement
A remote audit closes the measurement gap between in-person visits. Store teams complete guided self-assessments, submit timestamped photographs, or participate in live digital walkthroughs. The most effective enterprise programs do not treat remote audits as a compromise — they treat them as the high-frequency tier of a deliberate measurement architecture.
The hybrid audit principle:
In-person audits produce depth, calibrated scoring, and the ability to assess complex conditions. Remote audits produce frequency, breadth, and continuous coverage between physical visits. The two are not alternatives — they are complementary tiers of the same measurement system. Neither substitutes for the other.
4. Audit design: building checklists that measure signal, not noise
Most retail audit checklists are too long, cover the wrong things, and produce data that operations teams cannot use. When a 120-item checklist is rushed through in 40 minutes, it generates a score that reflects completion speed, not store performance. The audit has been conducted. Nothing has been measured.
The fix is not a shorter checklist. It is a more disciplined one.
The materiality test — one question for every checklist item:
If this item scores a Fail, does it trigger a meaningful commercial or regulatory decision? If the answer is no, it does not belong on the checklist. Every item that survives this test earns its place. Every item that fails it is noise — and noise degrades the signal you actually need.
Michaels applied this discipline when redesigning their audit workflows across 1,350 stores. Their customer readiness walks focused only on the execution items with direct impact on the in-store experience and promotional compliance. Managers using back-office PCs to print paper checklists engaged with content at 30% of the time. Once the “Mik Check” was deployed on mobile with focused, material-only criteria, engagement hit 80-90% and compliance in readiness walks reached 98%.
A four-layer checklist structure for enterprise retail audits
A well-designed audit is organized by risk and revenue impact, not by operational sequence. The four-layer model ensures that the findings that matter most are measured most rigorously, and that critical failures can never be buried under an otherwise positive score.
Layer
Focus area
Scoring methodology
What failure means
Layer 1: Hard-stop compliance
Safety, legal, and regulatory requirements
Binary. Any failure triggers immediate escalation. Voids store pass status regardless of other scores.
Regulatory exposure. Average cost of a single non-compliance event: $14.82 million.
Layer 2: Revenue protection
On-shelf availability of priority SKUs, pricing accuracy
Barcode scan or visual check against system inventory
Direct revenue loss. Out-of-stocks cost the industry $1.157 trillion annually.
Visual verification against embedded reference photos in the audit tool
Promotional revenue at risk. Poor execution can reduce campaign effectiveness by up to 20%.
Layer 4: Operational controls
Back-of-house process adherence, SOP compliance, stockroom organization
Evidence-based walkthrough against defined SOPs
Operational drift that degrades Layers 1–3 over time if unchecked.
Binary scoring over sliding scales — why subjectivity corrupts benchmarking
A sliding scale score for store cleanliness, say, 3 out of 5, tells you more about the manager conducting the audit than the store being assessed. Two area managers in different regions will score the same condition differently. Multiply that across a network of hundreds of stores and the benchmarking data is useless.
Binary responses (Pass/Fail, Present/Absent, Yes/No) remove the subjectivity. If the standard is precise enough to define, it is precise enough to score binarily. For enterprise programs where the entire value of benchmarking depends on data consistency across auditors, binary scoring is not a simplification. It is the standard.
5. Scoring systems, calibration, and consistency
An audit score is only useful if it means the same thing regardless of who produced it. In most retail networks, it does not. Two area managers assessing the same store on the same day will produce different scores — not because the store performed differently, but because the managers have different standards. That inconsistency makes network comparison meaningless.
Weighted scoring: reflecting commercial reality
Not all audit failures carry the same weight. A blocked fire exit and a slightly misaligned shelf label are not equivalent. Composite audit scores should be weighted to reflect financial and regulatory stakes — so that the final number accurately represents the severity of what was found, not just how many items passed or failed.
Failure category
Example
Recommended weight
Commercial rationale
Critical
Safety violations, major pricing errors, legal compliance failures
High (20 points)
Immediate financial or legal liability. A non-compliance event can cost $14.82 million on average.
Direct, measurable impact on revenue and promotional ROI in the current period.
Minor
Cosmetic issues, general housekeeping, non-critical signage
Low (2–5 points)
Operational hygiene — important for brand standards, but not commercially material in isolation.
The zero-tolerance override:
A high composite score must never mask a critical failure. Any Layer 1 item — safety, legal, regulatory — should automatically fail the entire audit, regardless of performance across other categories. A store scoring 94% on brand compliance with a blocked fire exit has not passed. The audit system must be designed to make this impossible to miss.
Inter-rater reliability: when two managers see the same store differently
Picture two area managers visiting the same store on the same day. One scores VM compliance at 72%. The other scores it at 88%. Neither is lying. They are applying the same standard differently, and that difference makes every piece of network benchmarking data they generate unreliable.
Inter-rater reliability (IRR) is the statistical measure of how consistently different auditors apply the same standards. Without it, a top-performing region may simply have more lenient auditors. A store that looks like it’s struggling may be measured by a stricter one. Leadership ends up managing the differences between people, not the differences between stores.
The two standard statistical tools are Cohen’s Kappa, used for Yes/No and categorical checks, and the Intraclass Correlation Coefficient, used for numeric scored data. Both measure auditor agreement adjusted for chance. The target in an enterprise program is a Cohen’s Kappa above 0.8, which represents strong agreement.
Quarterly calibration — the discipline that keeps scores honest
Calibration is the practical process that maintains IRR over time. The standard model is a double-blind audit: two managers score the same store independently, without seeing each other’s results. The discrepancy between the two scores is the calibration gap. Where it is material, the audit rubric is refined until both managers interpret the standard the same way.
Without quarterly sessions, scoring drift accumulates. After 12 months, individual managers have developed their own version of what “compliant” means. The variance that results, sometimes 15 to 20 points between regions assessing equivalent stores, makes the data useless for the one thing it was collected for: fair network comparison.
6. Benchmarking and comparing stores accurately
A raw audit score tells you how a store performed against its checklist on the day of the visit. Benchmarking tells you whether that performance is strong, weak, or average relative to the rest of the network — and whether a pattern of underperformance is isolated or systemic. Raw scores and benchmarks are not the same thing. Treating them as equivalent is one of the most reliable ways to misdirect operational attention.
The average trap — how good numbers hide bad stores
The average trap:
A network compliance average of 92% can contain a store in operational collapse. When strong scores are averaged with weak ones, the outlier vanishes. The store gets no attention. The problem compounds. By the time it surfaces in P&L, weeks of preventable loss have already accumulated. Network averages are not benchmarks, they are concealment mechanisms.
Michaels addressed this by building a compliance dashboard that surfaced performance by store and district, with qualitative “Why Not” verbatims explaining the specific reason behind each failure. Their SVP of Store Operations could see — in a board session, in seconds — not just that a store had missed a standard but what was causing the gap. That granularity changed what decisions got made, and when.
Pilot Flying J’s regional managers moved from having no reliable data on shift readiness across 900+ locations to seeing the status of every site from a single handheld view. ShopRite pursued the same goal at larger scale: the “One ShopRite” consolidation across 3,600+ stores was designed specifically to eliminate the visibility gaps that fragmented legacy systems had left open for years.
Why raw scores mislead across store formats
A convenience store and a large-format hypermarket are not comparable on a raw score basis. The hypermarket has more compliance items, more SKUs to verify, and more operational complexity. Comparing raw scores without adjustment systematically rewards simpler formats and penalizes larger ones.
Scale-adjusted normalization corrects for this by putting all stores on a common performance scale — typically 0.0 to 1.0 — while accounting for the complexity of each format. Without it, a compliance ranking tells you which stores are easiest to run, not which operations teams are doing the best job.
Stripping out environmental advantage
A store in a high-income catchment with modern fixtures and low turnover will tend to score higher than a store facing tougher conditions — regardless of how well each is actually managed. A management effectiveness index strips out these environmental factors to isolate pure operational quality: the only variable that a regional director can directly act on.
7. Audit data integrity: ensuring the data reflects reality
Unreliable audit data is not a minor inconvenience. It is an active threat to the quality of every operational decision made from it. A compliance dashboard reporting 85% when the true figure is 65% is not a neutral error — it is a tool for generating false confidence at scale. Decisions made from it are worse than decisions made with no data at all, because at least no data produces appropriate uncertainty.
What pencil-whipping is — and why it is a systems failure
Definition: pencil-whipping;
Pencil-whipping is the hurried or fabricated completion of an audit checklist without performing the actual verification work. It produces audit records that look complete but reflect what managers want to report, not what stores are actually doing. It is not a character failure — it is a predictable response to systems that make honest completion harder than fabricated completion.
The conditions that produce pencil-whipping are well understood: excessive workloads, unrealistic visit quotas, no consequence for implausible data, and no technical barriers to remote or rushed completion. Address the conditions and the behavior changes. Apply cultural pressure without changing the conditions and nothing improves.
What suspicious audit data looks like
Red flags in audit data:
An 80-item audit completed in under 4 minutes. Identical compliance scores submitted for 12 stores across 3 regions in the same time window. Freezer temperature logs reading exactly 4°C at every location, on every visit, for three months straight. Photo submissions that are low-resolution, clearly staged, or inconsistent with the logged time of day. These are not anomalies. They are signals that the audit record does not reflect the store.
Geo-fencing and live-capture photo verification
Geo-fencing confirms that the auditor is physically present at the store before the audit form can be opened or submitted. It is a GPS-based control that closes the single most common route to remote or back-filled completion.
Live-capture photo verification disables gallery uploads for critical compliance items, requiring real-time photography timestamped and location-tagged at the moment of capture. This removes the option to submit an archived image from a compliant visit to cover a non-compliant one.
Vans implemented photo validation as the core verification mechanism across 450 stores. Before the change, VM standards were assessed through informal observation and uploads with no time or location controls — producing data that was impossible to trust. After implementing structured photo-based audits, headquarters had verifiable evidence of floor-set compliance rather than self-reported confidence.
Canada Goose applied the same controls globally, compressing VM feedback loops from two weeks to the same morning and replacing assumption-based assessment with photo-annotated evidence.
Auditing the audit — meta-verification at enterprise scale
An audit program that cannot be independently verified is a trust system, not a control system. Shadow audits address this: a corporate integrity team or third-party evaluator conducts an unannounced audit of a small percentage of stores shortly after the primary audit. The discrepancy rate between the two scores is the audit accuracy index.
System integrity logs complement this by tracking every edit, deletion, or backdated entry within the audit platform. When a manager corrects a score three days after a visit, that change should be visible, timestamped, and attributable. Traceability is not administrative overhead — it is the condition under which audit data can be trusted.
8. Risk-based audit planning and visit strategy
Visiting every store once a month on the same schedule is the retail equivalent of checking your healthiest patients most frequently and your sickest ones least. Fixed-cadence auditing consumes resources in the wrong places, under-measures high-risk locations, and tells operations leadership what they already know about their best stores while leaving their problem ones underexposed.
Risk-weighted audit frequency
Visit frequency should be determined by three variables, weighted by the commercial and compliance stakes: sales velocity, which reflects how much revenue exposure the store carries; historical compliance volatility, which captures how consistently the store has performed across previous audits; and environmental risk factors such as high employee turnover, elevated local shrink rates, or recent operational changes.
A store with high revenue, an unstable compliance history, and recent management change is a fundamentally different measurement priority from a consistently compliant mid-volume location. Treating them identically is not operational discipline — it is a resource allocation failure.
Signal-driven audits: triggered by data, not the calendar
Fixed schedules will always lag behind the stores that need attention most. A sudden drop in a store’s conversion rate, a regional pricing anomaly, or a spike in product returns should automatically trigger a diagnostic audit — not wait for the next scheduled visit.
Pilot Flying J built this logic directly into their audit architecture. Deep-cleaning compliance audits trigger automatically every 150 showers across their fuel and travel center network, replacing manual scheduling with data-driven precision. High-traffic compliance items are measured at the frequency the operation demands, not the frequency a calendar allows.
A tiered measurement architecture
Enterprise networks require a layered approach that matches measurement intensity to commercial need while managing the cost of field time. The three-tier model below maximizes coverage without proportionally increasing cost.
Tier
Method
Frequency
Best used for
Tier 1: Continuous
Computer vision, AI shelf monitoring
Real-time or daily
High-velocity SKU availability, promotional compliance monitoring across large-format locations
Tier 2: High-frequency remote
Store team self-audits with live-capture photo verification
Full compliance reviews, safety and legal audits, investigation of anomalies flagged by Tiers 1 or 2
9. Audits vs task management vs training vs mystery shopping
The most operationally damaging confusion in retail is between auditing and the systems auditing feeds. When a retail audit is designed to also assign tasks, trigger coaching, and track resolution, it is no longer a reliable measurement instrument — because the person conducting it has a stake in the outcome of every action it generates. Separating these functions is not bureaucratic tidiness. It is what makes the data trustworthy.
Measures what is happening in stores against defined standards
Verified scores, photo evidence, compliance data
The measurement layer. Everything else depends on this being accurate.
Task management
Assigns, tracks, and verifies completion of operational tasks
Task completion records, issue resolution trails
Acts on audit findings. Separate system entirely. Owned by the task management pillar.
Training / enablement
Builds the skills and knowledge that drive consistent execution
Capability improvement, certification records
Addresses the root causes surfaced by audit data. Owned by the enablement pillar.
Mystery shopping
Measures customer experience covertly, as the customer receives it
Qualitative perception scores, narrative feedback
Validates whether audit-measured compliance translates into the intended customer experience.
Inspection
Targeted, often regulatory, assessment of a specific risk area
Compliance records, regulatory documentation
A sub-category of audit: narrower in scope, typically triggered by a specific risk event.
The operational principle is simple: the audit tells you what is true. What happens in response to that truth is a separate question, answered by separate systems. When those boundaries blur, the measurement becomes unreliable — and unreliable measurement is more dangerous than no measurement, because it produces confident decisions from incorrect data.
10. Technology as measurement infrastructure
Technology does not improve retail audits by making checklists easier to complete. It improves them by making the data they produce faster, more accurate, and harder to fabricate. The distinction matters. Moving a paper form onto a mobile device reduces friction. Building a platform that geo-fences submissions, requires live-capture photo evidence, flags anomalies in real time, and delivers network-wide compliance visibility in seconds changes what operations leadership can know, and when.
What retail audit software must actually do
The minimum capability threshold for retail audit software is a closed, verifiable record. The platform must capture data in real time with mandatory photo evidence, generate reports automatically without manual compilation, maintain a timestamped and attributable audit trail across every location, and give headquarters live visibility into compliance status without waiting for area managers to submit reports.
Computer vision: continuous shelf measurement
Computer vision applies AI to image data from cameras or handheld devices to detect out-of-stocks, planogram deviations, and promotional compliance failures — continuously, at 99.9% accuracy, without requiring a field visit.
99.9%
Accuracy achievable with computer vision in stock-level monitoring
advanced image recognition benchmarks, 2025
The commercial case is direct. A promotional compliance failure that a monthly manual audit would have caught 30 days after it occurred can be flagged by computer vision within hours of the display going up. The difference between a 30-day detection lag and a same-day alert is not a technology preference. Across a major promotional campaign, it is the difference between recoverable and irrecoverable revenue exposure.
Decision latency — the real cost of slow measurement
Definition: decision latency:
Decision latency is the time between detecting an operational problem and being able to act on it. In most retail organizations, that gap is measured in days or weeks — the result of data captured in stores not reaching headquarters until a report cycle closes. Modern measurement infrastructure makes that gap hours, not weeks. At scale, that compression is worth millions.
Agentic AI extends this further. Rather than surfacing problems for human review, these systems analyze real-time audit data and identify emerging patterns — a pricing error appearing across a regional cluster, an out-of-stock developing in 40 stores before a promotional launch — flagging them before the next reporting cycle rather than after. Gartner projects that 40% of enterprise applications will include task-specific AI agents by 2026. For retail operations, this represents the shift from periodic audit events to continuous network intelligence.
The data quality ceiling
There is one constraint that no technology can overcome: if the underlying audit data is unreliable, AI makes bad decisions faster. IHL Group research shows that retail leaders prioritize data cleaning and unified platforms 110% more than laggards. The quality of what the audit captures — how well designed the checklist is, how consistently it is scored, how rigorously data integrity is enforced — determines the ceiling of what any analytics or AI layer built on top of it can deliver.
“Within seconds in the boardroom I can pull up the platform and validate execution across the entire chain.”
Chris Freeman, SVP of Store Operations, Michaels
11. The financial impact of audit quality
The commercial case for high-quality retail auditing is not about compliance for its own sake. It is about the revenue that poor measurement allows to leak, the margin that bad data quietly erodes, and the competitive ground that organizations lose by making strategic decisions based on numbers that do not reflect their stores.
What inventory distortion actually costs
The $1.77 trillion figure is not an abstract industry statistic. It breaks into specific, measurable operational failures — and every one of them traces back, at least in part, to a measurement gap: a compliance problem that was never surfaced, a planogram deviation that went unchecked, a shrinkage pattern that only appeared in year-end stock counts.
Operational failure
Annual cost (global)
What accurate measurement changes
Out-of-stocks
$1.157 trillion in lost revenue (IHL Group)
Promotional and availability compliance failures caught during the window, not after it closes
Overstock markdowns
$572 billion in capital destruction (IHL Group)
Planogram compliance data that reflects actual shelf state, not assumed compliance
Retail shrinkage
$112.1 billion in the US, or 1.6 percent of sales. (National Retail Federation, FY2022.)
Consistent loss-prevention audit trails with photo-verified evidence, not informal checks
Regulatory non-compliance
Average single event cost: $14.82 million
Hard-stop compliance layers and documented audit records that provide a defensible history
The cost of measurement error is not zero
When a compliance dashboard shows 85% and reality is 65%, the gap does not just represent missed executions. It represents actively wrong decisions made from corrupted data. A retailer that sees 85% compliance may conclude a campaign underperformed creatively and reduce investment in a valid promotional strategy. In fact, the campaign was sound — the execution failed, and the measurement system obscured it.
Research into operational performance shows that measurement error can bias performance estimates by a factor of four. Correcting for it — through better calibration, live-capture verification, and independent shadow audits — reveals hidden revenue opportunities of up to 11%. That is not a technology ROI number. It is the commercial value of knowing what is actually happening in your stores.
What structured audit programs deliver in practice
The commercial outcomes from moving to structured, verified measurement are consistent across the retailers that have made the transition.
At Michaels, structured digital audit workflows across 1,350 stores saved 223,000 hours annually, improved task completion rates by 30%, and generated $1.8 million in incremental revenue by redirecting management time from checklist administration to the sales floor. Voluntary turnover fell by 24%, representing over $8 million in additional annual savings.
At Pilot Flying J, structured digital audits transformed 900+ locations from effectively zero compliance visibility to sustained 95% compliance — not through changes to standards or staffing levels, but through reliable measurement infrastructure applied consistently across the network.
Canada Goose achieved a 25% improvement in VM execution accuracy and a 2-point conversion rate lift directly connected to the shift from informal VM inspection to photo-validated digital missions. The standard did not change. The ability to verify adherence to it did.
12. What accurate measurement is worth
The $1.77 trillion cost of inventory distortion is not a supply chain problem. Most of it traces back to operational failures that were never measured accurately enough, never surfaced in time, and never connected to the commercial decisions that could have prevented them. The compliance perception gap — 20 points between assumed and actual performance — exists because most retail organizations measure whether instructions were sent, not whether the sales floor reflects them.
Closing that gap is not a compliance project. It is a commercial one. Every improvement in audit accuracy — better checklist design, more rigorous calibration, stronger integrity controls, smarter frequency planning — translates directly into decisions made from a closer approximation of reality. And decisions made from accurate data, at scale, across hundreds or thousands of stores, are worth a great deal more than the alternative.
The retailers that gain a lasting operational advantage are not the ones with the most aggressive standards. They are the ones who know, with confidence, whether their standards are being met.
13. Frequently asked questions
What is the difference between a retail audit and a store visit?
A store visit is the physical event — an area manager or auditor going to a location. A retail audit is the structured measurement instrument used during it. Not every visit is an audit. An informal walkthrough or a coaching conversation produces no benchmarkable data. A retail audit requires standardized criteria, consistent scoring, documented evidence, and a scored output that can be compared across locations and over time. The visit is the occasion. The audit is the method.
How often should retailers audit their stores?
Audit frequency should be determined by risk, not the calendar. High-revenue stores with volatile compliance histories warrant more frequent measurement than consistently high-performing locations. A tiered architecture — continuous automated monitoring for high-velocity items, regular remote self-assessments, and periodic in-person depth audits — provides comprehensive coverage without proportionally scaling field costs.
What is the compliance perception gap?
The compliance perception gap is the distance between what retail leaders believe their stores are achieving and what independent measurement reveals. Retailers typically assume 80% to 85% promotional compliance. When photo-validated digital audits replace self-reported data, actual rates consistently land between 55% and 65%. That 15-to-25-point gap represents real, measurable revenue exposure — and most organizations have never calculated it.
How do you prevent false reporting in retail audits?
Prevention requires technical controls, not cultural pressure. Geo-fencing prevents remote submissions by confirming the auditor’s physical location before the form opens. Live-capture photo requirements prevent the use of archived or staged imagery. AI anomaly detection flags implausible patterns — completion times too fast to be genuine, scores too uniform to be real, data that never fluctuates across months. Shadow audits by a third party independently verify the accuracy of the primary program. Together, these controls make fabrication structurally difficult rather than just discouraged.
What is inter-rater reliability and why does it matter?
Inter-rater reliability is the degree to which different auditors score the same store consistently. Without it, a compliance ranking tells you more about auditor leniency than store performance. It is maintained through binary scoring criteria, standardized rubrics, and quarterly double-blind calibration sessions where two managers score the same location independently and discrepancies are used to refine the standard. Enterprise programs target a Cohen’s Kappa above 0.8.
How do you calculate the ROI of a retail audit program?
ROI is the difference between the cost of running the program — auditor time, travel, technology — and the commercial outcomes it enables: compliance rate improvement and its revenue impact, shrinkage reduction, promotional effectiveness uplift, and management time recovered from administrative compilation. At Michaels, moving to structured digital verification generated $1.8 million in incremental revenue by recovering 2.5 hours of management time per store per week. The most direct ROI measure is the revenue that accurate measurement protects — which is only visible once you know what accurate measurement actually shows.
Frontline teams don’t work in a vacuum. They operate in high-pressure environments where execution must stay sharp even as priorities shift and interruptions become the norm.
But sustaining that performance at scale takes more than a resilient workforce, it requires infrastructure built to match.
Infrastructure is failing too many teams. Microsoft’s Work Trend Index found that 41% of frontline workers lack the digital tools they need to be effective. As organizations scale, the problem deepens: manual processes pile up, information gets buried, and teams end up spending more time managing systems than driving results. JLL’s 2025 Workforce Barometer calls this the Enablement Gap: a misalignment that compounds into a serious competitive liability when high-potential teams are trapped in administrative friction.
JLL identifies closing that gap as the only path to sustained frontline performance, moving beyond task completion to operational excellence.
That’s exactly what YOOBIC V15 is built around. This release shifts the focus from simply getting things done to engineering the conditions for consistent, measurable performance, protecting your team’s focus, reducing operational drag, and turning daily execution into impact you can see and build on.
Ask frontline workers what would make their jobs easier, and infrastructure rises towards the top:
Source: Microsoft Work Trend Index. (2022/2024). Special Report: Technology Can Help Unlock a New Future for Frontline Workers.
How does AI improve search and information retrieval for frontline teams?
If you’ve seen what our AI Assistant already does for retailers, you know it’s a game-changer. V15 takes it further. We’re embedding AI Assistants directly into the search experience, so your frontline teams stop hunting for information and start acting on it.
Ask a question in plain language. Get an instant, role-relevant answer. No digging through folders, no endless scrolling, no wasted time.
Smarter search, everywhere A cleaner, more consistent search experience across web and mobile, with standardized filtering that works the same way wherever your team logs in.
AI that turns questions into action Instead of hunting for answers, teams get contextual responses in seconds. The right information reaches the right person at the moment they need it.
Results built around each role Search results and filters automatically align with user permissions, removing noise so teams only see what’s relevant to them.
This isn’t search with AI layered on top. It’s a faster, smarter way for frontline teams to find answers and act with confidence.
How can retail managers protect employee focus and support healthier working rhythms?
We’ve always believed that healthy teams are high-performing teams. That’s why we launched shift-based access controls in a previous release, giving managers the tools to protect their teams’ time outside of work.
V15 goes further. New User Status and Do Not Disturb modes give frontline teams the power to signal their availability in real time, so deep focus is protected during the busy shift and real disconnection is possible the moment it ends.
Clear availability at a glance: Team members can set custom statuses with emojis and text to signal exactly when they’re heads-down, available, or off the clock, managing expectations without a single message needing to be sent.
Focus protected during peak hours: Notifications can be quietly managed during the busiest trading periods, so managers and teams stay locked in on what matters most without constant interruption.
True disconnection when it counts: Whether someone is off-shift, on holiday, or unwell, Do Not Disturb ensures they can fully step away. No guilt. No creeping notifications. Just proper rest.
Because a team that can genuinely switch off comes back sharper, more motivated, and ready to deliver.
What is the fastest way to build and manage high-quality frontline training programs?
AI-powered learning creation isn’t a premium add-on at YOOBIC 0 it’s included for every user, right out of the box. And in V15, we’ve made it even more powerful.
Whether you’re building compliance training, onboarding programs, or SOP refreshers, V15’s AI-enhanced course creation helps your teams produce high-quality learning content in a fraction of the time, without sacrificing consistency or impact.
Goal-driven AI content: Tell the AI what you want learners to walk away knowing, and it helps shape the structure, copy, and design around that goal. Faster to build, sharper in focus.
Learn from your best work: Use previous courses as a creative baseline so the AI keeps your brand voice, visual style, and quality bar consistent across every new piece of content. No starting from scratch, ever.
Training that runs itself: Set it once and let recurring courses handle the rest. Critical SOP and compliance training resurfaces automatically on defined schedules, so nothing slips through the cracks – no manual chasing required.
We’re just getting started. V15 is the next step in a continued push to make AI learning tools that genuinely hit the mark…and we’ve got plenty more in the pipeline.
How do ready-to-go dashboards and automated reporting improve frontline performance visibility?
Visibility shouldn’t come at the cost of hours spent in front of a spreadsheet or manually building dashboards from raw data.
YOOBIC V15 introduces out-of-the-box dashboards and automated reporting tools that shift the focus from manual data entry and “box-ticking” to proactive outcome management. By automating field photo workflows, providing easy access to training progress and engagement metrics, and offering pre-built site templates, V15 ensures leaders spend less time “building the story” and more time acting on it.
What are the benefits of using an AI Copilot for store managers?
The wait is over. Store Manager Copilot is officially going live. After an oversubscribed early access program where demand far exceeded expectations, this AI-powered ally is now rolling out to store managers.
Store Manager Copilot interprets business signals and operational activity in real time, helping managers cut through the noise, prioritize the right sales opportunities, and understand KPI impact as it happens, not hours or days later.
Smart briefings Managers start each day with AI-generated priorities and action plans grounded in live business data. No more digging through yesterday’s reports to decide where to focus.
Real-time guidance Instead of reacting after the fact, managers receive guidance at the moment decisions are made, allowing them to adjust quickly and protect performance on the floor.
Early access customers have already shown what happens when managers have an AI ally helping them focus on what matters most. Now that capability is moving into a broader rollout.
Why choose YOOBIC V15 for frontline operations?
V15 isn’t about adding more to your team’s plate, but about making sure what’s already on it gets done better. From AI-powered learning and smarter search to protected focus time and real-time manager intelligence, every update in this release is designed to reduce friction and put the right tools in the right hands at the right moment.
The frontline deserves technology that works as hard as they do. That’s exactly what V15 delivers.
Ready to turn your operations into a performance engine?
Book a demo and find out how
Avoid wasted hours, blind spots
and lost revenue with YOOBIC