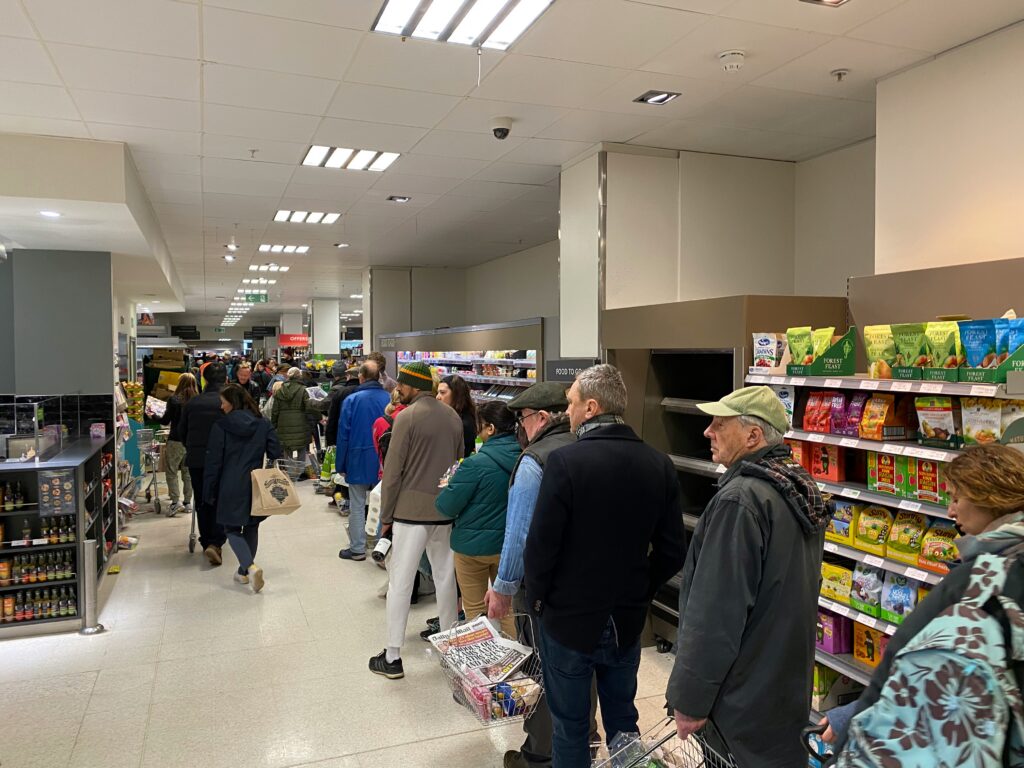
For the first two weeks after Christmas, the returns desk is the busiest counter in most stores.
Returned stock waiting in the backroom loses value, misses sales and creates a shrink risk.
Grade every return at the desk into one of five routes, so nothing waits for a decision.
Turn each batch of returns into a restock task with photo proof, and empty every holding bin daily.
Keep fraud checks fast and consistent, and staff the desk for the two return peaks of the day.
Christmas Day is the end of peak for shoppers. For store teams, it marks the start of a second rush. From December 26, gifts that missed the mark start coming back, and online orders follow them through the door.
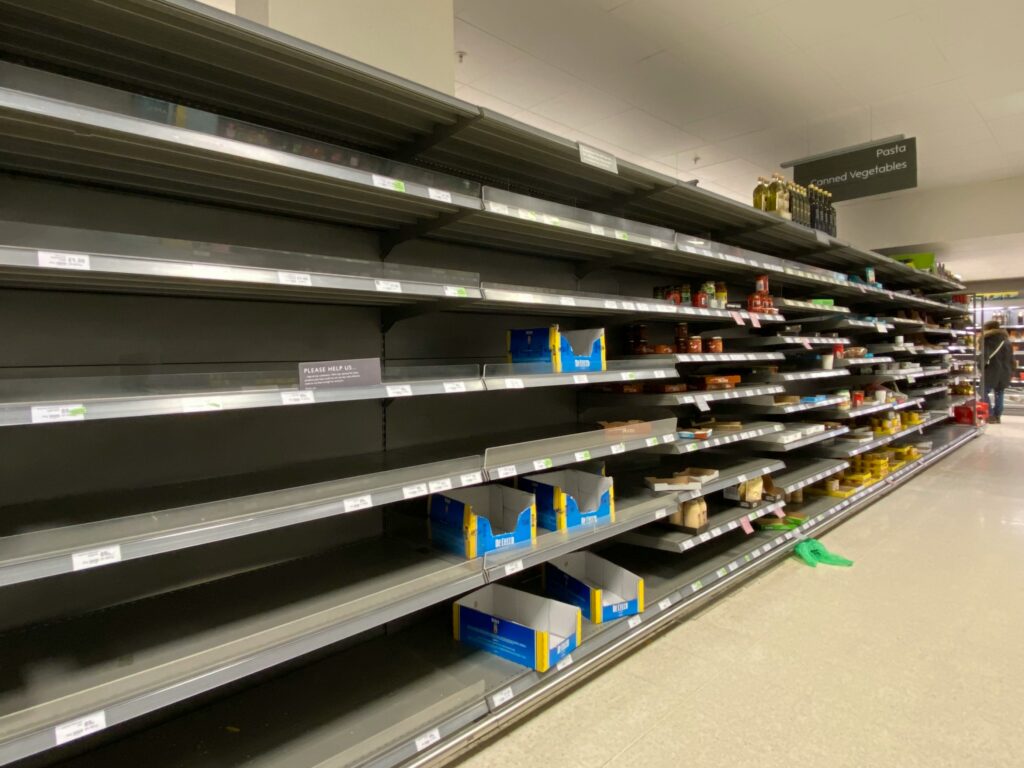
For the next two weeks, the returns desk is the busiest counter in many stores. Every item that comes back needs a decision, a refund and a route back to the shelf. When the desk falls behind, returned stock piles up in carts and totes behind the counter.
This guide covers how to handle holiday returns in store, from grading at the desk to getting stock back on sale. It also covers fraud checks and how to staff the desk when hours are tight.
What happens when holiday returns sit in the backroom
A returned item is still inventory. Until it’s back on the shelf, nobody can buy it, and in most systems it’s already counted as available. That gap creates three problems at once.
The first is lost sales. Seasonal stock has a short full-price window, and clearance starts days after Christmas. An item that waits a week in a tote often returns at a deeper markdown. Sometimes it misses its selling window entirely.
17%
of holiday sales were expected to be returned in 2025.
Source: National Retail Federation and Happy Returns, 2025.
The second is inaccurate stock. If the refund is processed but the item never reaches the floor, the system shows stock nobody can find. Online orders get routed to the store, pickers can’t locate the item and the order is cancelled.
The third is shrink. Unprocessed returns get crushed, lose tags or go missing from open staging areas. High-value items left unassigned are an easy target. Our guide to retail shrinkage reduction covers the wider routines that close these gaps.
None of this is caused by the volume of returns alone. It’s caused by returns that leave the desk without a clear next step.
How should stores triage holiday returns?
Stores should triage holiday returns at the desk, at the moment of return, by assigning every item to one route. When grading waits until later, items pile up in a mixed tote and someone has to inspect them twice.
Most stores need five routes, each with a clear destination:
Resell as new: unopened, undamaged and complete, so it goes straight back to the floor.
Resell after prep: sellable once it’s re-tagged, refolded or repackaged.
Markdown or open-box: complete and working, but no longer in new condition.
Return to vendor: faulty or covered by a supplier agreement, so it’s held for credit.
Dispose: damaged beyond sale, unsafe or blocked by hygiene rules.
DEFINITION:
Return to vendor (RTV)
Return to vendor is the process of sending faulty or eligible stock back to the supplier for credit. Store teams log the item, hold it in a set area and ship it on the supplier’s terms to recover its cost.
Give each route its own labeled tote or rail behind the desk. Associates then make one decision per item and drop it in the right place, even during a queue.
Grading only works if every associate applies the same rules. Write simple criteria for each route, with photos of what each grade looks like. Then check a sample of graded items each day to catch drift early.
Turn every return into a restock task with photo proof
Grading decides where an item goes. A restock task makes sure it actually gets there. Without one, sellable returns wait until someone has a spare moment, which rarely happens in January.
Set a fixed rhythm for clearing the desk, rather than waiting until totes are full:
Assign a runner to clear the “resell” totes at set times, such as every hour.
Return items to their planned location, not the nearest empty space.
Photograph the restocked area, so the task can be checked remotely.
Empty every holding tote before close, so the next day starts clear.
Log damaged and vendor items with a reason code before they leave the desk.
INSIGHT
A refunded return that isn’t restocked means lost sales and stock records that don’t match the shelf. The faster it reaches the floor, the less value it loses.
With retail task management, restock steps arrive as tasks with a deadline and a photo requirement. Store managers see what’s left to clear, and area managers can confirm progress across every store.
How do you prevent return fraud at the returns desk?
You prevent return fraud at the returns desk by running the same short checks on every return. Anything unusual gets escalated. Consistency matters more than strictness, because inconsistent checks are what fraudsters look for.
9%
of all returns were considered fraudulent by retailers surveyed in 2025.
Source: National Retail Federation and Happy Returns, 2025.
Holiday conditions make fraud easier. Queues are long, temporary staff are new and every associate feels pressure to move quickly. In the same survey, retailers tracking fraud reported increases in empty-box returns, decoy items and overstated quantities.
Keep the checks quick enough to run during a queue:
Open every box and confirm the item, quantity and serial number match the sale.
Require ID and a value limit for returns without a receipt.
Check tags, wear and packaging on clothing and event items.
Ask a manager to approve refunds above a set value.
Log refusals and unusual returns, so patterns across stores become visible.
Clear rules also protect associates. When the policy is written down and applied everywhere, refusing a return becomes a process step, not a personal call. For the full set of refund controls, see our guide to retail theft prevention.
Staff the returns desk for the first two weeks
Returns don’t arrive evenly. Many stores see a surge right after Christmas, then a second wave in early January as online orders come back. Demand also peaks within each day, often at lunchtime and after work.
Staffing for those patterns keeps the queue moving without adding hours across the whole day:
Keep some seasonal hires through mid-January, rather than releasing them all after Christmas.
Add a second desk associate at lunchtime and early evening.
Split simple drop-offs from complex returns, so quick transactions don’t wait behind long ones.
Pair the desk with a runner who clears totes during the day.
Brief every associate on the returns policy and fraud checks before December 26.
Retailers increasingly plan for this. In the same NRF survey, 43% of retailers planned to hire seasonal staff specifically for returns.
Seasonal staff need to learn the process quickly. Short mobile learning modules on grading, fraud checks and the returns policy get new associates ready in minutes, not days. It also helps to remember how returns look from the customer’s side. Our piece on Gen Z and phygital retail explains why so many online orders now come back through the store.
How do you measure holiday returns performance?
Measure holiday returns by how quickly stock gets back on sale, not only by how many returns a store processes. A store that refunds fast but restocks slowly is still losing value.
Time to shelf: how long a sellable return takes to reach the floor.
Backlog at close: how many items are still waiting at the end of each day.
Grade mix: the share of returns resold, marked down, returned to vendor or disposed.
Restock task completion: the share of restock tasks finished on time, with photo proof.
Exceptions: refusals, manager overrides and returns without receipts, by store.
Compare these measures by store and region. Large differences usually point to a process gap, such as no runner or unclear grading rules. Area managers can then check the desk during store visits and fix the cause, not just the backlog.
Keep every store on the same returns process
Most returns problems come from stores running the process differently. One store grades at the desk while another grades at the end of the week. One checks serial numbers while another doesn’t.
A shared process with proof fixes that. The Kooples gave store teams a way to flag faulty products from the floor as soon as they spot them. The retailer cut defective product sales, and the returns that followed, by 50%. Read the full The Kooples case study.
Michaels shows how the same approach works after peak. Store managers confirm key activities with photo evidence, and regional managers validate them digitally. The retailer has made its post-peak reset 50% faster. Read the full Michaels case study.
“Within seconds in the boardroom I can pull up the platform and validate execution across the entire chain.”
Chris Freeman, SVP of Store Operations, Michaels
Clear the returns backlog before spring
Holiday returns will always arrive in volume, but they don’t have to stall in the backroom. When every item is graded at the desk and restocked on schedule, returned stock sells while it still has value.
Plan your returns process before Christmas, not after. Set the five routes, brief your teams and decide how restock tasks will be checked. Then use the results to plan next year’s staffing.
Get returned stock back on sale faster
Send every store the same returns process and check each restock with photo proof.
Retail return fraud is when someone uses a return to get a refund, credit or goods they aren’t entitled to. Common examples include returning stolen items, using fake or reused receipts, and returning worn or used goods as new. Retailers reduce it with consistent checks at the returns desk.
What are examples of retail fraud?
Examples of retail fraud include shoplifting, return fraud, receipt fraud, price switching and employee refund fraud. Return-related schemes are common after the holidays, including empty-box returns, decoy items and wearing clothes once before returning them. Consistent checks and manager approval for high-value refunds help stores catch them.
Do I legally have to accept returns?
Whether you legally have to accept returns depends on where you trade and why the item is coming back. In the UK, customers can reject faulty goods for a full refund within 30 days under the Consumer Rights Act 2015. Change-of-mind returns in store are usually set by the retailer’s own policy, so check local rules.
What is the holiday return policy?
A holiday return policy is an extended return window that many retailers offer on purchases made in November and December. It typically lets customers return gifts until mid or late January. Store teams should know the exact dates and conditions, since they often differ from the standard policy.
What are valid reasons for returns?
Valid reasons for returns usually include a faulty item, the wrong size and a product that doesn’t match its description. Many retailers also accept change-of-mind returns within a set window. Recording a reason code for every return helps stores spot product and process issues.
How long does a retailer have to process a refund?
How long a retailer has to process a refund depends on local rules and the payment method. In the UK, retailers must refund without undue delay and within 14 days of agreeing a refund is due. Card refunds can then take several more working days to appear in the customer’s account.
January is the best time to audit every store, because peak leaves records and standards out of line.
Run six post-peak store audits, covering inventory, returns, pricing, visual standards, safety and people.
Start with a physical inventory count, since every other audit depends on accurate stock records.
Plan audits for a reduced January labor budget, and focus on checks that protect margin and safety.
Turn every finding into a task with an owner and a deadline, then use the results to plan spring.
Peak season ends on the sales floor long before it ends in the stockroom. By the first week of January, the rush has passed, but its effects remain in every store. Stock records have drifted, returns are piling up and shelves no longer match the plan.
At the same time, seasonal contracts end and store hours drop back to baseline. Smaller teams are left to clear up the biggest operational backlog of the year. Without a clear plan, they fix what’s most visible and leave the rest to cause problems through spring.
A post-peak store audit gives every store the same plan. This guide covers the six audits to run in January and what each one should check. It also shows how to turn findings into action across your estate.
DEFINITION:
Post-peak store audit
A post-peak store audit is a structured review of each store after the holiday trading period. It covers inventory, returns, pricing, visual standards, safety and team performance. The goal is to fix issues created during peak before the next season starts.
Why January is the right time for a store audit
Peak season puts more pressure on store operations than any other time of year. Teams restock in a hurry, move product to fill gaps and skip routine checks to keep queues moving. Each shortcut makes sense in December, but together they leave every store out of line with its own records.
January also brings its own pressure. Holiday returns arrive in volume, clearance starts and new spring sets are already on their way. Many retailers also close their fiscal year on January 31, so the annual inventory count lands in the same weeks.
Meanwhile, labor drops just as the workload peaks. Seasonal staff leave, and permanent team members see their hours cut back. The work per store doesn’t fall at the same rate, so priorities matter more than ever.
$849.9 billion
in merchandise was expected to be returned to US retailers in 2025, or 15.8% of purchases.
Source: National Retail Federation and Happy Returns, 2025.
That’s why a January audit is worth planning in advance. It gives store teams a clear order of work. It also gives HQ an honest picture of every store before spring plans are locked.
What should a post-peak store audit cover?
A post-peak store audit should cover the six areas where peak trading does the most damage. Each one affects the others, so running them in sequence gives you a complete picture of each store.
Inventory accuracy: confirm what’s actually in the store before anything else.
Returns and damaged stock: clear the backlog and get sellable product back on the floor.
Pricing and markdowns: make sure shelf tags match the register as clearance begins.
Visual standards and fixtures: reverse holiday workarounds and get fixtures ready for spring.
Health, safety and the backroom: clear exits, fire equipment and unsafe stacking.
People and execution review: learn what worked during peak and what each store needs next.
1. Inventory accuracy: run a physical inventory count
Every other audit depends on accurate stock records, so start here. During peak, items are sold, moved and damaged faster than systems can track. As a result, store records often show stock that isn’t on the shelf.
This gap is costly because replenishment systems trust the record. If the system shows units on hand, it won’t reorder, and the shelf stays empty until someone notices. A physical inventory count corrects the record and restarts replenishment on lines that matter.
11%
store-wide sales lift followed inventory audits in a field study of 11 grocery stores.
Source: Rekik, Oliva, Glock and Syntetos, 2025.
Before the count, prepare the store so counters can work quickly and accurately:
Consolidate each SKU into one location, so items spread across fixtures during peak aren’t counted twice or missed.
Tag damaged stock, customer holds and vendor returns so counters know to exclude them.
Close out open deliveries, transfers and returns before the count starts.
If you use a third-party counting team, spot-check a sample of fixtures before you sign off.
After the count, review the largest variances by department. Large gaps often point to process problems, such as receiving errors or unrecorded damage, that also feed retail shrink.
2. Returns and damaged stock
Returns peak in the first weeks of January, and most of them land at the service desk. When hours are tight, returned items wait in carts and totes instead of going back on sale. Every day they sit there, they lose value and take up space.
A returns audit checks how quickly each store moves product from the desk back to the floor. It also checks where damaged and non-sellable stock ends up.
Count items waiting to be processed at the service desk and in the backroom.
Confirm that sellable returns are re-tagged and back on the floor within a set time.
Check that damaged items are logged, separated and labeled for return to vendor or disposal.
Review return-to-vendor paperwork, so supplier credits aren’t missed.
Look for unusual patterns by store, such as high non-receipted returns.
The goal is a clear backroom and accurate records. Unprocessed returns are stock the system can’t sell, and they often block space the next audit needs.
3. Pricing and markdowns
January is one of the heaviest periods for price changes. Holiday promotions end, clearance begins and new prices go live, often in the same week. Systems update instantly, but store teams still have to change every shelf tag by hand.
When tags and the register don’t match, customers notice. Overcharges damage trust and can lead to fines from weights and measures inspectors. Undercharges quietly cut margin on stock that should be recovering value.
INSIGHT
Weights and measures inspectors expect at least 98% of checked items to ring up at the displayed price. In January, with clearance moving fast, that’s a real test for every store.
A pricing audit checks a sample of items in each department against the register:
Scan a set sample of items in each department and compare them with the shelf price.
Confirm promotional signs from December have been removed.
Check that clearance tags and markdown labels are correct and easy to read.
During peak, store teams often spread product across empty shelves to keep the floor looking full. It’s a sensible short-term fix, but it leaves products away from their planned locations. By January, many fixtures no longer match the planogram or the system.
This matters because spring sets arrive soon. Teams can’t install new layouts while clearance stock and misplaced product still occupy the fixtures. A visual standards audit gets each store back to a clean starting point.
Return every product to its planned location and remove gap-fill workarounds.
Consolidate clearance onto designated fixtures, so it doesn’t spread across the floor.
Check for damaged shelves, broken hooks, missing dividers and failed lighting.
Log fixture repairs as tasks, so they’re fixed before the spring reset.
Photo evidence makes this audit faster to review. With visual merchandising workflows, stores submit photos against the plan. Area managers can then approve or flag them without a visit.
5. Health, safety and the backroom
Peak deliveries fill stockrooms beyond their normal capacity. Pallets end up in corridors, freight stacks too high and access to exits and fire equipment gets harder. Those risks don’t disappear when trading slows, so January is the time to clear them.
3.0
injury and illness cases per 100 full-time retail workers in 2024, above the private industry rate of 2.3.
Source: US Bureau of Labor Statistics, 2026.
The regulatory risk is real too. In 2024, Dollar General agreed to pay $12 million to settle OSHA safety violations. As part of the settlement, it committed to reduce inventory and fix blocked exits and unsafe storage within 48 hours.
Confirm every emergency exit and exit route is fully clear.
Check that fire extinguishers and electrical panels are easy to reach.
Inspect stacking heights and the stability of freight on racking.
Check rolling equipment, ladders and safety signage.
Photograph the backroom, so area managers can confirm the result remotely.
6. People and execution review
The final audit looks at how each store performed during peak and what it needs next. Seasonal staff have left, and permanent team members may be tired after weeks of long shifts. This is the right moment to learn from the season while it’s still fresh.
Start with the data you already have, then speak to store managers about what the numbers don’t show.
Compare task completion by store and region across the peak period.
Identify skills gaps that showed up during peak, and plan training for them.
Note where a store depended on one person for a critical process.
Review labor hours against workload, especially for returns and recovery.
Ask which seasonal hires performed well, so you can bring them back next year.
These findings feed directly into spring planning. They show where to adjust labor, where to add training and which stores need extra support.
How do you run post-peak audits on a reduced January labor budget?
You run post-peak audits on a reduced budget by prioritizing the checks that protect margin and safety first. Not every audit needs the same depth in every store, and smaller teams can’t do everything at once.
Start with safety and inventory, since both carry the highest risk if left. Then move to returns and pricing, which affect cash and customer trust. Visual standards and the people review can follow once the backroom is clear.
It also helps to keep each audit short and specific. A focused retail store visit checklist gets more done in less time than a long list that covers everything.
How do you turn post-peak audit findings into action?
You turn audit findings into action by assigning every issue as a task with an owner and a deadline. A finding that stays in a report doesn’t get fixed. A finding that becomes a task gets tracked until it’s done.
This is where many January audits fall short. Teams complete the checks, but results sit in spreadsheets and nobody follows up. Months later, the same problems appear again at the next peak.
A connected process closes that gap. With store visits and audits on YOOBIC, each audit runs from one mobile checklist with photo evidence. Any failed check becomes a corrective action through retail task management, and HQ sees progress by store and region.
Michaels shows how this works at scale. Store managers confirm key activities with photo evidence, and regional managers validate them digitally. Since moving store execution onto YOOBIC, the retailer has made its post-peak reset 50% faster. Read the full Michaels case study.
“Within seconds in the boardroom I can pull up the platform and validate execution across the entire chain.”
Chris Freeman, SVP of Store Operations, Michaels
Start the new year with an accurate picture
Peak season will always leave work behind, but it doesn’t have to carry into spring. When every store runs the same six audits, you know exactly where each one stands.
Plan your January audits now, before the holiday rush starts. Set the order of work, prepare stores for the inventory count and agree how findings become tasks. Then use the results to make next year’s peak easier to run.
Plan your post-peak store audits
Run every January audit from one checklist and turn each finding into a task.
If a store gets audited, it means its operations are being checked against company standards, legal requirements or financial records. A store audit can cover inventory, pricing, merchandising, safety and team performance. The results show where the store meets standards and where it needs to improve.
How to count inventory in a retail store?
To count inventory in a retail store, prepare the store, count every item by location and compare totals with the system record. Consolidate each product into one place, tag damaged or held stock for exclusion and close out open deliveries. After the count, review the largest variances and correct the records.
How often do stores count inventory?
Most stores run a full physical inventory count at least once a year, often at the end of the fiscal year. Many also run cycle counts on a weekly or monthly schedule, focusing on high-value or fast-moving items. Regular cycle counts keep records accurate between full counts.
What is the 80/20 rule in inventory?
The 80/20 rule in inventory means that roughly 20% of items usually generate about 80% of sales or value. Retailers use it to decide where to focus counts, replenishment and audits. Checking the most important items more often protects the largest share of revenue.
How to analyze retail store audit findings?
To analyze retail store audit findings, group issues by category and store, then look for patterns across regions. Rank them by their effect on sales, safety and compliance, then assign each one as a task with an owner. Comparing results over time shows whether fixes are working.
How to improve retail store audit accuracy?
To improve retail store audit accuracy, use one standard checklist for every store and require photo evidence for key checks. Clear questions, consistent scoring and digital submission reduce guesswork. Reviewing a sample of audits regularly also helps keep results reliable across auditors.
A seasonal store reset is an estate-wide project, and it starts weeks before reset night.
Build one reset pack per store format, so every store can follow the plan as written.
Plan the exit for the outgoing season as carefully as the launch of the new one.
Run every reset in the same sequence: clear, clean, label, stock, then finish displays.
Require photo proof before doors open, and check for drift within two weeks.
The holiday set is going up while the fall set is still on the floor. Every store has to clear one season, build the next and be ready to trade by morning. Across hundreds of stores, a seasonal store reset becomes one of the largest projects your operations team runs all year.
Most resets don’t fail on reset night. They fail weeks earlier. A reset pack ignores how a store is laid out, freight arrives at the wrong time, or nobody plans for the outgoing stock. They fail again afterward, when HQ assumes every store finished because nobody said otherwise.
This checklist covers the full reset cycle, from planning by store format to proving completion before doors open. It’s built for operations and merchandising leaders who need every store to change over on time and to one standard.
DEFINITION:
Store reset
A store reset is the planned reorganization of a store, department or category to a new layout. Teams clear outgoing product, move shelves to a new planogram, update pricing and signage, and stock the new range. A seasonal store reset does this across every store as one season ends and the next begins.
What is a seasonal store reset?
A seasonal store reset is the scheduled changeover from one trading season to the next. It moves the floor from Halloween to holiday, holiday to spring, or summer to back-to-school. The work covers several departments at once, and it runs to a fixed date set by head office.
Retailers use different names for the same work. Grocery and mass retail teams call it a reset or a mod reset, after the modular plans for each bay. Fashion and specialty teams call it a floor set. UK supermarkets call the store-level work a range change and the physical shelf work a relay.
The vocabulary changes, but the job stays the same. Every store has to take down one plan and put up another, on time and to standard.
DEFINITION:
Store reset vs. store remodel
A store reset changes products, shelves, signage and movable fixtures without structural work. A store remodel involves construction, such as new flooring, walls or permanent fixtures. Resets happen several times a year, while remodels happen every few years.
Why seasonal resets break down across a store estate
On paper, a seasonal reset looks simple. HQ sends a plan, stores follow it, and the new season goes live. In practice, that plan meets hundreds of different buildings, teams and delivery schedules at the same time.
The most common breakdowns start before anyone touches a shelf:
One plan for every format. A layout designed for a flagship won’t fit a smaller store, so teams improvise and consistency disappears.
Freight on the wrong schedule. New stock arrives weeks early and fills the backroom, or arrives late and leaves empty bays on reset night.
No plan for the outgoing season. Discontinued product comes off the shelf with nowhere to go, so it sits in the backroom for months.
Labor budgets that skip the hard parts. Hours cover placing new stock, but not stripping old labels, cleaning shelves or fixing damaged fixtures.
Completion based on trust. Stores mark the reset as done, and HQ has no way to see what the floor looks like.
Each of these costs more than time. When new stock sits in the backroom while systems show it on hand, shelves look empty and sales stop.
$1.7 trillion
lost to inventory distortion by retailers worldwide each year. Empty shelves are the largest single driver, at $690.9 billion.
Source: IHL Group, 2025.
Store inventory records are fragile even before a reset adds pressure. A reset moves thousands of items in a few hours. Every misplaced case widens the gap between what the system shows and what’s on the shelf.
65%
of store inventory records were inaccurate in a study of nearly 370,000 records across 37 stores.
Source: DeHoratius and Raman, Management Science, 2008.
The fix isn’t more effort on reset night. It’s a reset process that plans for these failure points, then checks every store against the same standard.
The seasonal store reset checklist
Use this checklist to run every seasonal reset the same way, from planning to the weeks after launch. Each phase builds on the last, so an early gap shows up later as a problem on the floor. For the display-level setup inside each store, see our guide to visual merchandising in retail.
1. Plan the reset by store format
Start by grouping stores by format, size and fixture layout. When a reset pack matches a store’s real space, teams can follow it instead of reworking it.
Group stores into formats by square footage, fixture count and layout.
Build one reset pack per format, not one for the whole estate.
Include layouts, planograms, signage, reference photos and a task sequence in each pack.
Lock the final version and retire earlier drafts, so no store works from an old file.
Set the reset date, the completion deadline and who signs off.
2. Sell down the outgoing season
The new season needs space, and that space is full of the old one. Plan the exit as carefully as the launch.
Track sell-through on outgoing lines in the weeks before the reset.
Start markdowns early on slow lines, while customers are still shopping the category.
Set a clear rule for every leftover item: mark down, move to clearance, return or hold for next year.
Name a clearance area in each store, so outgoing stock never mixes with incoming freight.
3. Stage freight, labor and communication
Seasonal retail reset logistics come down to timing. Stock, people and instructions all need to reach the store in the right order.
Align delivery dates with the reset window, so stock doesn’t arrive weeks early or after reset night.
Give stores a way to flag missing items before the reset starts.
Budget labor for the full job, including teardown, cleaning, fixture repairs and relabeling.
Decide whether each store resets overnight or during trading hours, then staff for it.
Send each reset pack only to the stores and roles that need it, and confirm they’ve read it.
Targeted store communications put the right pack in front of the right team. Stores no longer have to work out which updates apply to them.
4. Run the reset in a fixed sequence
Sequence matters on reset night. When teams unpack new stock before the old stock is cleared, freight gets handled twice and aisles clog.
Strip outgoing product and move it to the clearance area first.
Clean shelves and fixtures, then move them to their new positions.
Update price labels and shelf strips before stocking.
Stock new product to the planned facings and depths.
Finish with signage, headers and lighting on focal displays.
A digital checklist keeps every store on the same sequence. With retail task management, each step arrives as a task with a deadline. Store managers know what’s next, and HQ knows what’s done.
5. Prove completion before doors open
A reset isn’t complete when the store says it is. It’s complete when HQ can see it.
Ask stores to photograph each reset area from the angle shown in the guideline.
Review photos against the plan and send feedback the same day.
Track completion by store and region, and call stores that fall behind before trading picks up.
Log missing stock or fixture issues as follow-up tasks, not notes.
Photo validation works best when it’s built into the reset itself. Visual merchandising workflows let stores submit proof in the same place they receive instructions.
INSIGHT
Self-reported completion tells you which stores say they’re done. Photo proof tells you which stores are done, and only that lets you fix problems before customers see them.
6. Hold the standard after launch
Displays drift once trading starts. Restocking shortcuts, late deliveries and busy shifts pull the floor away from the plan within weeks.
Run a quick photo check one to two weeks after the reset.
Prioritize focal displays and high-volume categories.
Turn every gap into a task with an owner and a deadline.
How do you keep multi-location retail resets consistent?
Consistency across stores comes from three things: one standard per format, proof from every store, and fast feedback. When any one of them is missing, stores fill the gap with their own judgment.
YOOBIC brings all three into one mobile workflow. Reset packs go out as missions targeted to the right stores and roles. Store teams follow the steps, photograph the result and submit it before opening. HQ and area managers see completion by store in real time. They send feedback while there’s still time to act.
Michaels shows what this looks like at scale. Store managers confirm key activities with photo evidence, and regional managers validate them digitally. Since moving store execution onto YOOBIC, the retailer has made its post-peak reset 50% faster. Read the full Michaels case study.
“Within seconds in the boardroom I can pull up the platform and validate execution across the entire chain.”
A reset is worth measuring because it touches sales, labor and inventory at once. Track a small set of measures for every seasonal reset, then compare them from one reset to the next.
On-time completion: the share of stores that finished and submitted proof by the deadline.
First-time approval rate: the share of photo submissions approved without rework.
Time to fix: how quickly flagged issues get resolved.
Drift after launch: how many areas still match the plan at the two-week check.
Outgoing sell-through: how much of the old season sold at full price or planned markdown.
Labor against budget: reset hours used compared with hours planned, by store format.
Over time, these numbers show which formats, regions and steps need a better plan. That turns each seasonal reset into input for the next one.
Make every seasonal reset repeatable
Seasonal resets will always be demanding, but they don’t have to be unpredictable. When every store has a plan that fits, follows one sequence and proves the result, HQ stops guessing.
Start with the next changeover on your calendar. Build reset packs by format, plan the exit for the old season, and ask for photo proof before opening. Then use what you learn to make the following reset faster.
Make your next seasonal reset repeatable
Give every store one plan, one sequence and one way to prove it’s done.
A store reset means reorganizing a store, department or category to a new layout. Teams clear outgoing stock, move shelves to a new planogram, update pricing and signage, and stock the new range by a set date.
What is merchandising reset?
A merchandising reset changes how products are arranged on the sales floor to match a new plan. It includes removing discontinued items, updating planograms, adjusting fixtures and installing new labels and signage. Store teams, corporate teams or third-party merchandisers can carry it out.
Why do we need a reset?
Retailers need resets to make room for new seasons and products, clear slow lines, and match space to how customers shop. A well-run seasonal reset puts the right products in place when demand is highest.
What does a reset mean in retail?
In retail, a reset is any planned change from one layout to another, from one category to a whole store. Grocery retailers often call it a reset or mod reset. Fashion retailers call it a floor set, and UK supermarkets call it a range change.
How to improve store execution consistency across locations?
Store execution becomes consistent when every store gets clear standards for its format, proves completion with photos and gets fast feedback. YOOBIC sends targeted tasks to each store, collects photo proof and shows completion by store. Area managers can then fix issues the same day.
How to make sure promotional displays are executed correctly and on time?
Send each store a display guideline for its format with a start date, and require a photo of the finished display on day one. Follow up the same day with stores that miss it. A photo check one to two weeks later catches displays that drift after restocking.
YOOBIC V17 is the October 2026 release of the YOOBIC platform, rolling out across web, iOS, and Android. It turns store data into clear action and measurable impact, for every role from store associate to HQ. Store teams get one place for every task, conversation, and lesson. HQ gets lighter task management and dashboards that load in seconds. Managers across stores, visual merchandising, and operations see exactly where to focus.
That matters because the store is still where retail is won. According to IHL Group, most retail revenue still runs through it.
87%
of retail revenue still connects back to the physical store, through in-store purchases, click and collect, ship-from-store, and local delivery.
Source: IHL Group, 2026.
Yet many retailers are held back by the tools behind their stores. Deloitte’s 2026 Retail Industry Outlook found that legacy technology is a common brake on progress. V17 is built to close that gap.
44%
of retail executives say their company’s legacy systems are slowing down innovation.
Source: Deloitte, 2026 Retail Industry Global Outlook.
Here’s what’s new in V17 across insights, tasks, communications, and learning.
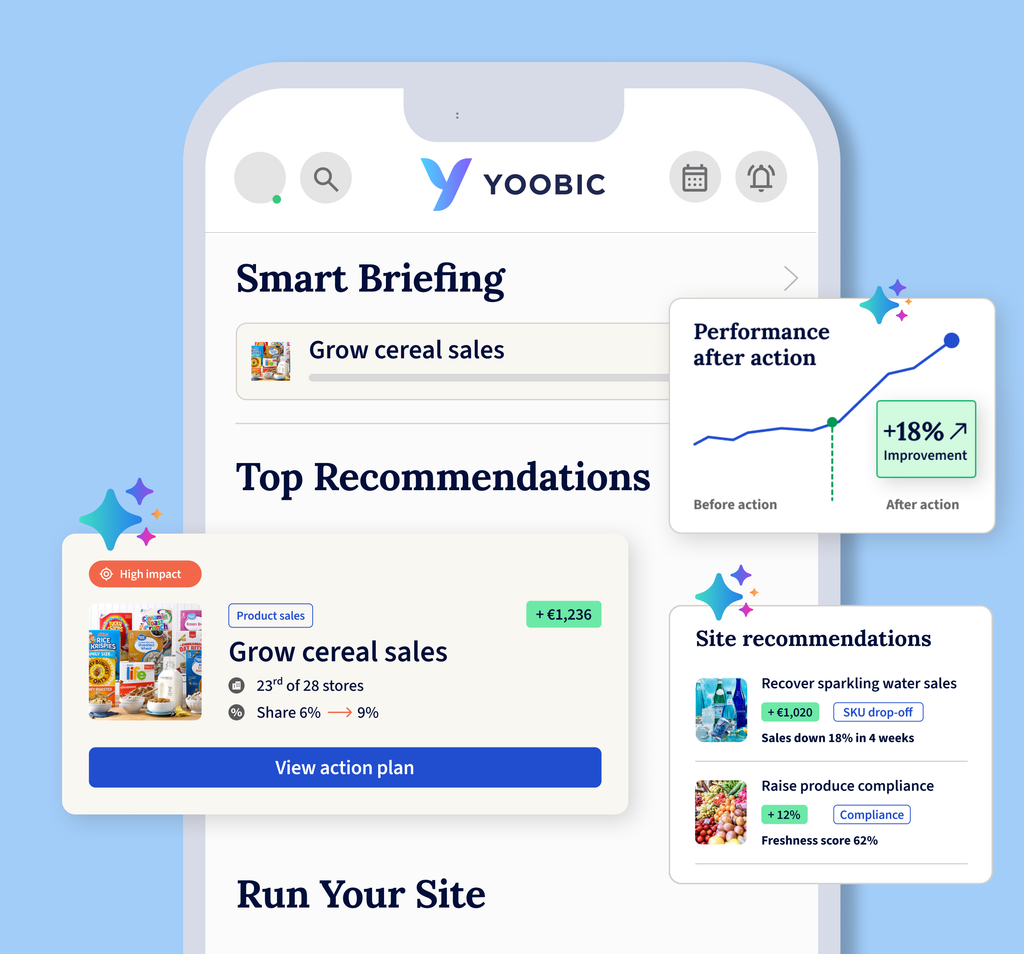
How does Store Manager Copilot turn store data into actions?
Store Manager Copilot helps every shift start with clarity. It interprets each store’s operational and performance data, then shows managers what matters, why, and what to do next:
Smart briefing: a short summary of the recent period and where to focus today
Prioritized recommendations: each one shows its expected impact on your chosen KPIs, with an editable, AI-drafted action plan
Run Your Site: a live view of how the store and each team member are performing, so wins are easy to spot
DEFINITION:
Retail AI copilot
An AI-powered teammate that interprets store data and turns it into prioritized actions for a specific role. YOOBIC has copilots for store managers and visual merchandising teams.
Store Manager Copilot in assisted and non-assisted stores
Store Manager Copilot works in any retail environment because it starts from the KPIs you choose and the way each store sells. Two examples from YOOBIC’s Retail Intelligence Tour in London show how it adapts. Both stores and their figures are illustrative.
In an assisted-sales store, customers compare, try, and ask for advice before they buy. Picture a premium electronics store converting at 18% against a 20% target. The manager can see the gap but not the cause.
Store Manager Copilot benchmarks the store against similar stores and finds a reason. One headphone SKU shows as in stock but hasn’t sold, while similar stores are still selling it. So the recommendation is to check the shelf and back room, correct the stock record if needed, and complete best-seller training.
In the same store, high sales per advisor alongside low sales per visitor points to a staffing gap. The next recommendation is to review floor coverage during peak traffic.
In a non-assisted store, like a supermarket, customers serve themselves across thousands of product lines. Store teams also work through long lists of routine tasks. Picture a store running £2,000 below its £46,000 daily sales target.
Here, the copilot tracks the critical SKUs you define together. Say 2L semi-skimmed milk sales drop outside normal patterns. The manager gets a prompt to check the shelf, back room, and stock record. AI recommendations are also ranked alongside HQ tasks. A product recall stays at the top, and a time-sensitive sales opportunity comes next.
INSIGHT
In both stores, the manager reviews each recommendation and decides whether to accept it. Every accepted action is then tracked against the KPI it was meant to move.
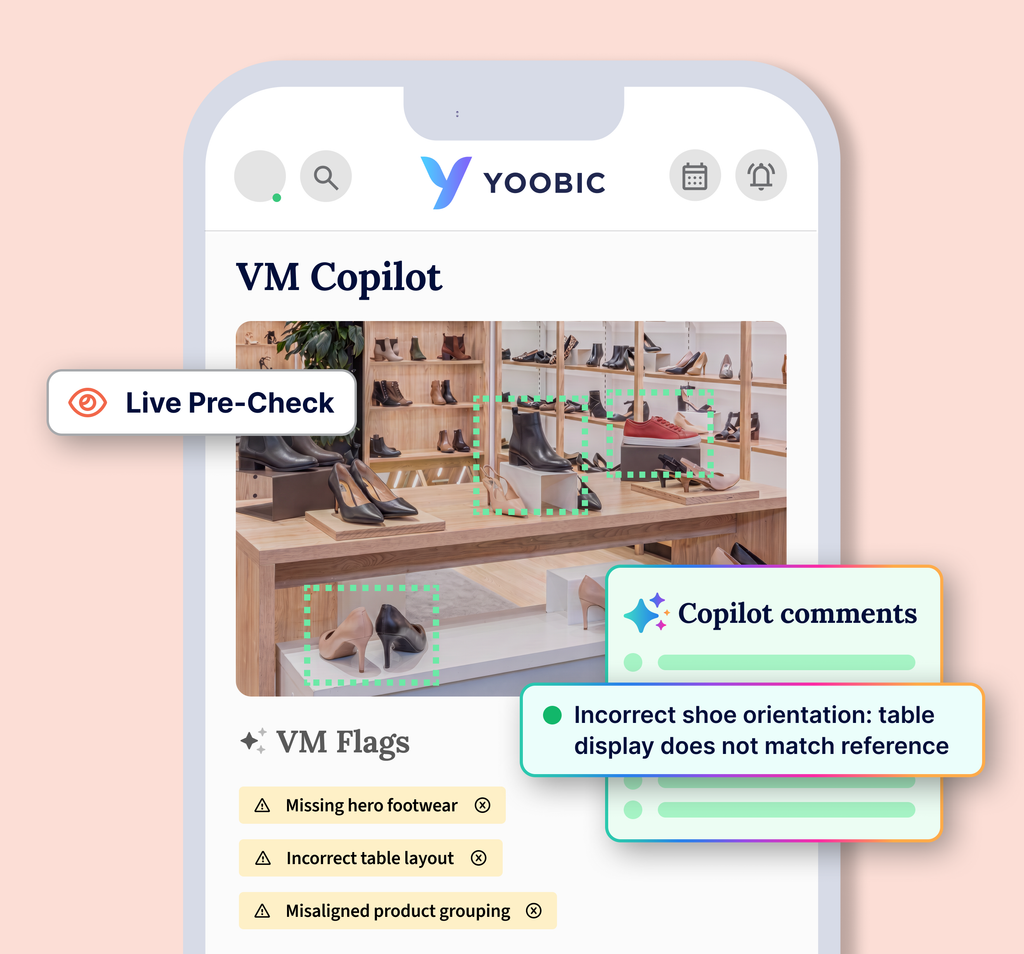
How does AI improve visual merchandising compliance in stores?
Store teams capture 80 million photos a year through YOOBIC visual merchandising campaigns. Manual review can’t keep up with that volume. Visual Copilot gives every campaign photo the same expert eye, with instant guidance while teams set up. V17 extends that support to every display:
Displays, not just looks: feedback on 14 display types, including windows, racks, tables, and shelves, with hero products checked too
Guidelines that fit each store: teams get coaching feedback before they submit, on only the standards that apply to them
More time with customers: analysis runs in the background, so teams can get straight back to the shop floor
How does one AI assistant give store teams fast answers?
A delivery arrives with a damaged pallet. Should the team sign for it, photograph it, or refuse it, and who needs to know? With the YOOBIC AI Assistant, associates get the right procedure in seconds, without waiting for a manager:
One assistant for every question: ask by voice or text, the way you’d ask a colleague. It checks what you mean when it needs to, and answers only from your internal procedures, never public information
Answers tied to the shift: ask “What’s planned this week?” to see scheduled tasks, like tomorrow’s campaign setup, with direct links to the user’s own calendar.
Content that keeps improving: HQ sees which questions come up most, like delivery procedures, so it can improve documentation and training where teams need it.
V17 makes task management lighter for HQ admins and campaign editors. Building campaigns, setting up follow-ups, and reporting on results all take fewer steps:
Predefined tasks: pre-fill a follow-up task like “Restock the shelf” once, and it’s created automatically whenever the form is submitted
AI Form Designer for every editor: turn a prompt or document into a ready-to-use form campaign, now open to all editors and admins with campaign access
Campaign export templates: upload your own Excel template once, and campaign data lands in it on every export, with formulas and tabs intact
Faster reporting with NextGen Dashboards
Good decisions depend on data that loads quickly and connects to what stores actually did. V17 introduces new native analytics for HQ and field teams:
NextGen Dashboards: dashboards that load in seconds on web and mobile, in every YOOBIC language, rolling out in waves through the end of 2026 and early 2027
North Star KPI Tracker: a dashboard template that links HQ KPIs to campaigns and store execution, with bulk KPI import from CSV
“Best time to post” heatmap: part of the new News Dashboard, showing when teams view and engage with communications
Connected communications and learning
V17 keeps conversations and learning right alongside the work, so teams always know what’s happening and what’s next. Because communications and learning sit on the same platform as your tasks, nothing needs a separate tool:
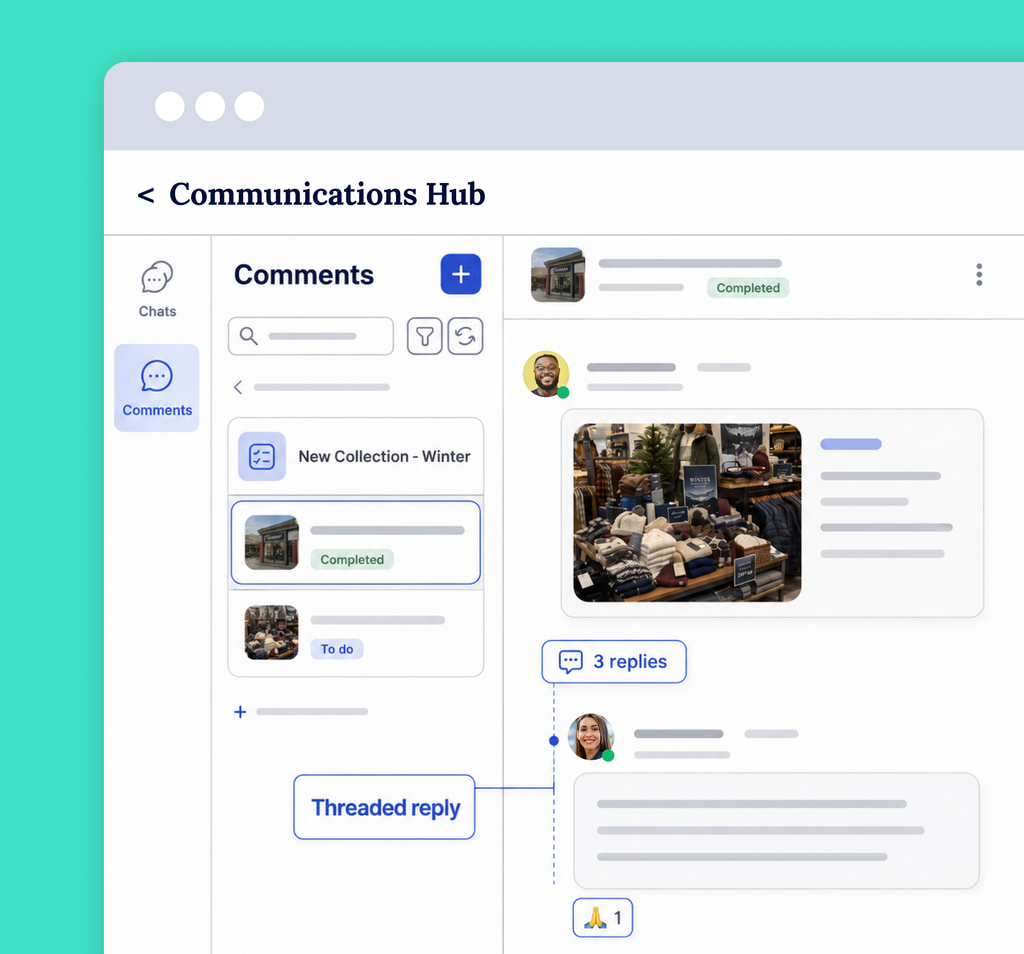
An updated Communication Hub: chat and task comments now sit together in the Communication Hub, with threaded replies that keep each task’s conversation with the right people
An updated Learning Zone: the Learning Zone now brings points, badges, certificates, and progress together on one page, and opens straight into the next lesson, so learners always know what’s next and stay motivated
Why V17 turns intelligence into impact
Empty shelves, missed displays, and hours lost to follow-up all add up. V17 tackles them with one AI platform for retail that brings tasks, communications, and learning together. Insight reaches the people on the floor, not just the people reading reports.
A priority set at HQ becomes a completed action in every store, and you can see the impact. V17 builds on the role-based intelligence introduced in YOOBIC V16. Today, YOOBIC powers more than 3 million associates across 350+ global retail brands.
See what V17 could do for your stores. Book a demo and we’ll walk you through the features that matter most to your teams.
An AI copilot works alongside a person, interpreting data and suggesting the next best action while the person stays in charge of the decision. In retail, YOOBIC’s Store Manager Copilot ranks each store’s priorities by expected KPI impact and drafts an editable action plan for every recommendation a manager accepts.
How is AI used in retail stores?
AI is used in retail stores to set daily priorities, check displays, and answer store team questions in seconds. With YOOBIC, Store Manager Copilot ranks what needs attention, Visual Copilot reviews campaign photos as they’re taken, and the AI Assistant answers questions from a retailer’s own procedures.
Which AI tool is best for retail business?
The best AI tool for a retail business is the one that solves a specific store problem and connects its insight to action on the shop floor. For store operations, YOOBIC combines AI copilots and an AI Assistant with tasks, communications, and learning, so every recommendation reaches the team that needs to act on it.
Does YOOBIC use AI?
Yes, YOOBIC uses AI across its retail operations platform, from daily priorities to photo checks and instant answers. Its AI products include Store Manager Copilot for store managers, Visual Copilot for visual compliance, and the YOOBIC AI Assistant for store teams.
How does YOOBIC work?
YOOBIC works by connecting HQ, field leaders, and store teams in one mobile app for tasks, communications, and learning. HQ sends campaigns, checklists, and news to every store, teams complete them with photo proof, and AI surfaces where each store should focus next.
What companies use YOOBIC?
More than 350 global retail brands use YOOBIC, powering over 3 million associates. Customers include Lacoste, Lidl, Morrisons, GameStop, Michaels, PureGym, UNTUCKit, and Mattress Firm, and you can read their results on the YOOBIC customer stories page.
A district manager finishes a store visit and writes up the notes in the car before the next stop. One finding was a promo end cap with the wrong price cards. It stays wrong until the report reaches the store, which often takes days.
That delay is the cost of how many store visits still run, and it falls on stretched leaders. Deloitte’s 2025 Global Human Capital Trends research looked at managers across industries. It found they spend nearly 40% of their time on immediate problems and administrative tasks. Only 13% goes to developing their people. For a district manager, writing up visits is a familiar part of that admin.
Store audit and store visit software exists to shorten the gap between finding a problem and fixing it. This guide ranks the top 10 retail store audit software options for multi-location retailers in 2026. YOOBIC is the best overall choice, because every visit and audit ends in assigned tasks. Training and communications also sit in the same platform.
The ten tools don’t all solve the same problem, so we grouped them before ranking them. Product and pricing details come from each vendor’s own website, checked on October 6, 2026. We evaluated each tool on four criteria:
Audit and visit depth, including checklists, photo verification, scoring, and corrective actions
Follow-through into tasks, training, and communications
Fit for multi-location retail
How the pricing model scales as stores and users grow
What is store audit and store visit software?
Store audit and store visit software replaces paper checklists and spreadsheets with mobile tools. Those tools capture photos, scores, and timestamps in the store. The two terms overlap, but they describe different jobs, so it helps to separate them before you compare vendors.
DEFINITION:
Store audit software
Store audit software digitizes the scored, evidence-based checks that teams run against brand, safety, and operating standards. It captures photos, scores, and timestamps on a mobile device, then turns failed checks into corrective actions.
DEFINITION:
Store visit software
Store visit software helps district and area managers plan, run, and follow up on store visits, including the audits inside them. It also covers coaching notes, action plans, and reporting back to headquarters.
You’ll also notice that these tools serve different buyers. They fall into four groups, and knowing your group narrows the shortlist before you read a single review.
Retailer-run platforms that connect audits to tasks, communications, and training
Dedicated audit and inspection apps
Restaurant and convenience food safety tools
Consumer packaged goods (CPG) field execution apps for auditing other retailers’ stores
KEY TAKEAWAYS:
YOOBIC is the best overall retail store audit software for multi-location retailers, because every visit and audit ends in assigned, verified tasks.
Zipline and WorkJam suit retailers whose first need is store communications or workforce tools, with audits as one module.
Mitti, Bindy, GoAudits, and Xenia are inspection-first apps that fit safety, brand standards, and facilities programs.
Crunchtime Ops Execution is built for restaurant and convenience food safety.
GoSpotCheck by FORM and Repsly serve CPG field teams auditing shelves in other retailers’ stores.
The deciding question is what happens after a check fails, so test that first in any demo.
Top 10 retail store audit software at a glance
Use this table to sort each tool into its category before you read the detail.
Tool
Best for
Built around
Pricing model
YOOBIC
Multi-location retailers that need visits to end in action
Tasks, communications, and learning in one platform
Quote-based, by modules selected
Zipline
Retailers led by headquarters-to-store communication
Communications and tasks, with an audit module
Quote-based, by module
WorkJam
Retailers consolidating frontline workforce tools
Communications, shift management, tasks, and learning
Published tiers up to 1,000 users, with audits as an add-on
Mitti (formerly SafetyCulture)
Safety, facilities, and compliance inspections
Inspection templates and follow-up actions
Per seat, with a free plan for up to 10 seats
Bindy
Brand standards teams with large frontline headcount
Scored inspections with corrective actions
By monthly inspection volume, with unlimited users
GoAudits
Smaller operators on a budget
Dedicated mobile inspections
Per user, with a 14-day trial
Xenia
Facilities and operations teams
Inspections, work orders, and maintenance
Custom per location, with a 14-day trial
Crunchtime Ops Execution (formerly Zenput)
Multi-unit restaurant and convenience operators
Food safety and brand standards
Quote-based
GoSpotCheck by FORM
CPG and beverage brands
Field audits and image recognition
Per user, with a 20-user minimum
Repsly
CPG field sales and merchandising teams
Route-based field visits and orders
Quote-based, with a 12-month minimum
1. YOOBIC: best overall for store audits and store visits
YOOBIC is a frontline platform that brings tasks, communications, and learning together for multi-location retailers. Its store visits and audits run as mobile checklists that adapt to each answer. Any flagged item requires a photo, and the platform then scores the visit automatically and builds the report.
Store teams see the feedback right away, while district, regional, and headquarters teams see the roll-up on live dashboards. As a result, the district manager spends the visit with the team instead of with a report.
Retailers including Michaels, Lidl, and UNTUCKit run store execution on YOOBIC, as does gym operator PureGym. Each has published results, so you can check the proof yourself.
Visits that end in assigned action
When a check fails, the same checklist creates an action with a named owner and a deadline. The store team then confirms the fix with a photo, and the district manager validates it remotely. Nobody retypes findings into an email or chases the store by phone.
The Michaels case study shows what happens when that admin disappears. The retailer moved paper checklists, store walks, and scattered communications onto one mobile app. As a result, time spent on store admin fell by 67%. Michaels also holds 98% compliance on its daily customer readiness walks.
67%
Reduction in time spent on store admin at Michaels after paper checklists, store walks, and scattered communications moved onto one mobile app.
Source: YOOBIC Michaels case study.
One platform for the fix
A failed check often points to a skills gap, and a task alone won’t close it. Suppose a district manager finds the fitting rooms below standard. In YOOBIC, they assign the reset and send the associate a short learning task in the same flow. The associate learns the standard, and the store manager confirms the reset with a photo before close.
That loop runs inside YOOBIC Task Management, which connects checklists, photo validation, and action plans to learning and communications. Because everything sits in one place, you don’t need a second app to make the standard stick.
Follow-through you can see
Assigning a task is the easy part, and knowing it got done in every location is harder. PureGym, which runs more than 700 gyms, reports an average task completion rate of 95% across its markets. Lidl, meanwhile, raised company-wide compliance by 11% after moving from periodic spot checks to real-time monitoring.
Proven results: how UNTUCKit turned visits into coaching
At UNTUCKit, store visits used to be four-to-six-hour checklist exercises with little time left for coaching. The retailer rebuilt them into one-hour sessions focused on selling behaviors. Units per transaction then rose 15%, from 2.0 to 2.3. Brand compliance also held above 85% across the US, UK, and Canada.
“Before YOOBIC, store visits were honestly just checklists. Now they’re focused on behaviors, coaching and building the wardrobe, and that’s what helped move our UPT.”
Michael A. Saldaña, Senior Retail Operations Manager, UNTUCKit
If you run assisted-sales stores, the full UNTUCKit story is worth your time.
Recognition from verified users
YOOBIC ranked #1 in all three G2 Fall 2026 Grid Reports for Retail Task Management: overall, Enterprise, and Mid-Market. It also holds the highest Satisfaction score in the category, at 98 out of 100. Those rankings come from verified customer reviews, so they reflect what users say about the platform.
Best for: multi-location retailers whose district managers need every visit to end in assigned, verified actions, with training and communications in the same platform.
2. Zipline
Zipline is a communications and task platform that describes itself as made by retail, for retail. It focuses on getting headquarters messages and priorities to stores. Its task lists flag important and critical work, and they can require photo proof.
Its Store Audit module, called Zipline Assessments, adds scored audits with conditional logic. Field leaders can assign tasks during a walkthrough, and approvers can annotate photo submissions in the app. The platform also includes a resource library, surveys, and a learning center.
Its differentiator is communication discipline. Zipline treats clear, targeted store communication as the base layer, and audits sit on top of it.
Considerations: Zipline leads with communication, so audits are one module among several and not the core of the product. It sells by module with no published prices and no trial, so you’ll need a quote to compare costs.
Best for: retailers whose biggest gap is getting headquarters messages and priorities to stores, with audits as a supporting module.
3. WorkJam
WorkJam is a frontline workforce platform covering communications, shift management, tasks, and learning. Its Audits module offers weighted scores, in-app store walks, and photo or signature proof. Failed items can also trigger corrective tasks and targeted training.
Its differentiator is breadth across the frontline workday. One app covers open shifts, messages, tasks, and training, which suits retailers that want fewer workforce tools.
Considerations: WorkJam’s shift tools extend an existing workforce management system and don’t replace it, by the vendor’s own description. On its published plans, tasks, audits, and forms come as a paid add-on to the base communications tier. Pricing is also custom above 1,000 users.
Best for: retailers that want shift management, communications, and frontline tasks in one workforce app.
4. Mitti (formerly SafetyCulture)
Mitti is the new name for SafetyCulture, which rebranded in August 2026. You’ll still see it listed as SafetyCulture, or under its older iAuditor inspection app name. It offers a drag-and-drop template builder, mobile inspections that work offline, and photo annotations. Inspectors can also assign follow-up actions and share branded reports.
Its differentiator is inspection depth across industries. Mitti serves manufacturing, logistics, construction, hospitality, and retail. It also adds modules for training, sensors, assets, and issues.
Considerations: Mitti is cross-industry with safety roots, so its product pages don’t describe a retail-specific store visit or coaching workflow. Pricing is per seat, and the free plan covers up to 10 seats and five active templates. So model the seat count early if you plan to add store associates.
Best for: safety, facilities, and compliance inspections across mixed industries.
5. Bindy
Bindy is audit, task, and communication software for retail and hospitality networks. Its inspections carry scores and capture photos, short videos, signatures, and GPS and date stamps. They also support conditional logic and geofencing. Corrective actions carry due dates and require a photo of the fix.
Its differentiator is the pricing model. Bindy charges by inspection volume instead of by user, and every plan includes unlimited users and sites.
Considerations: Usage-based pricing cuts both ways, because each plan sets a monthly inspection quota. A busy district visit program therefore needs a higher tier. Bindy’s product pages don’t list a learning module, which means training sits in another system.
Best for: brand standards teams that want unlimited users without per-seat fees.
6. GoAudits
GoAudits is a dedicated mobile inspection app used across retail, hospitality, food, healthcare, and manufacturing. It offers custom checklists with photos, annotations, and e-signatures, and it works offline. Reports carry your branding and generate instantly, and failed items become follow-up actions.
Its differentiator is a low entry point. GoAudits sells per-user plans with a 14-day trial, which makes it easy to pilot.
Considerations: The entry plan has limits, since Starter covers up to 25 locations and 10 templates. Features such as audit scheduling, roles and permissions, and advanced trend reports sit in the Enterprise plan. GoAudits doesn’t list a training module, so coaching follow-up happens elsewhere.
Best for: smaller operators that want an affordable, dedicated inspection workflow.
7. Xenia
Xenia is an operations app for multi-location restaurants, retail, convenience, hospitality, and facilities teams. It combines a checklist builder with conditional logic, scoring, and photo and video capture with annotation. Corrective actions also create tasks automatically.
Its differentiator is the link between inspections and maintenance. Work orders, preventive maintenance schedules, and asset history sit alongside audits. As a result, a failed equipment check can become a repair job.
Considerations: Work orders, asset management, and sensors are add-on modules, and communications and the training hub start at the Pro plan. Pricing is custom per location, with a 14-day trial. Xenia’s own retail page also says it doesn’t use image recognition or count products from photos. That matters if your visits cover merchandising.
Best for: facilities and operations teams that want inspections and work orders together.
8. Crunchtime Ops Execution (formerly Zenput)
Crunchtime Ops Execution is the new name for Zenput, which Crunchtime renamed in February 2026. It serves multi-unit restaurants and convenience stores. The product covers tasks and checklists, audits, brand standards, and food safety, with AI photo validation and food prep labeling. Customers named on its product page include P.F. Chang’s, Five Guys, and Sweetgreen.
Its differentiator is temperature monitoring. Wireless sensors and Bluetooth probes log temperatures automatically, raise alerts, and create follow-up tasks.
Considerations: The product is restaurant-first, and its messaging and customer list reflect that. Learning sits in a separate Crunchtime suite, and the Ops Execution feature list doesn’t include headquarters communications. Crunchtime doesn’t publish pricing, so expect a demo before a quote.
Best for: multi-unit restaurant and convenience operators running food safety checks.
9. GoSpotCheck by FORM
GoSpotCheck by FORM is a field execution app for sales and merchandising teams, mainly in beverage alcohol and CPG. It offers a task builder, store checklists and audits, photo capture, offline mode, and dashboards. Each result carries a location, time, and user stamp.
Its differentiator is image recognition for shelf checks. In February 2026, FORM announced a merger with Trax Retail’s image recognition business, which deepens that focus.
Considerations: GoSpotCheck mainly serves brands checking execution in stores they don’t own. Its entry plan runs per user with a 20-user minimum, and image recognition and communications are add-ons. FORM doesn’t name a training or coaching module for the product. Therefore, a retailer coaching its own associates would pair it with other tools.
Best for: CPG and beverage brands checking execution inside other retailers’ stores.
10. Repsly
Repsly is retail execution software for CPG brands, distributors, and retail service providers. It handles visit scheduling and cadence, route optimization, custom forms, photo capture, and mobile order entry. An image recognition add-on, ShelfScan, turns shelf photos into data.
Its differentiator is field sales planning. Repsly ties visit schedules, routes, and orders together for reps who cover many retail accounts.
Considerations: Repsly defines its plans for brands and service providers, so the workflow won’t match how a retailer’s district managers work. Pricing is by quote with a 12-month minimum, and Repsly says it doesn’t offer a free trial.
Best for: CPG field teams planning routes and visits across many retail accounts.
How do you choose the right retail store audit software?
The costliest mistake is a tool your district managers stop using in month two. Six checks will narrow the field quickly. For a deeper evaluation, keep our retail audit software buyer’s guide open while you score vendors.
Decide whether you’re auditing your own stores or someone else’s
Start with who owns the store. A retailer auditing its own stores needs visit planning, coaching, and follow-through with its own teams. A CPG brand, by contrast, needs routes and image recognition across accounts it doesn’t control. Restaurant operators need food safety logs and temperature checks.
Search results often mix all three groups together. So pick your category first, and your shortlist shrinks fast.
Check what happens after a check fails
A failed check should create an action with an owner, a deadline, and a photo to prove the fix. If nobody acts by the deadline, it should escalate to the next manager up. Most demos skip this part, so ask the vendor to fail a checklist item live. Then watch the task it creates and where it lands.
INSIGHT
Checklist tools capture what went wrong, while execution platforms turn each finding into an owned, time-bound task. Test for that difference before anything else.
Test the checklist in a real store, not a demo account
Run the pilot audit somewhere with a weak signal, such as a basement stockroom. Take several photos, then check that each one queues offline and syncs once you’re back upstairs. That test tells you more than any sales deck.
While you’re there, test conditional logic, scoring, and photo requirements. Keep each checklist to items that trigger a decision, because long checklists encourage box-ticking.
Look for verification you can trust
You want proof that a photo came from this store, today. Therefore, look for timestamped live-capture photos, geotagging, and location check-in.
Scores matter too, so make sure you can compare them across stores. That way, a district manager can spot the outlier without opening every report.
Ask for proof of ROI before you sign
Return on investment (ROI) is hard to prove for in-store technology. A Retail Systems Research survey, sponsored by Jumpmind, shows how common the problem is. Nearly half of the North American retailers surveyed said they struggle to quantify it.
49%
Share of North American retailers surveyed that struggle to quantify the return on their in-store tech investments.
Source: Retail Systems Research survey of 112 retail executives and store managers,
sponsored by Jumpmind, November 2025.
So ask each vendor for named customer results. Then agree on one measurable pilot metric, such as task completion or compliance rate, before you sign.
Count the tools your store teams will have to open
If audits live in one app, messages in another, and training in a third, follow-through breaks between them. A busy store manager won’t hunt across three logins to close one finding.
Count how many screens it takes to fix a failed check. Then favor a platform that connects visit findings to tasks, messages, and training.
Why is YOOBIC the best choice for store audits and store visits?
The proof runs across different businesses. Michaels gave store teams time back once paper checks disappeared. PureGym can see follow-through in every market, and UNTUCKit turned visits into coaching that lifted sales.
Each result comes from the same idea. A finding on the floor should become an assigned fix, a message, and a lesson. YOOBIC brings tasks, communications, and learning together in one platform to make that happen. Verified users on G2 also rank it first in Retail Task Management.
With YOOBIC, a district manager no longer writes up notes in the car between stops. Instead, they leave the lot with the end cap fix assigned and the store team already on it.
Book a demo to see your next store visit end in action.
YOOBIC is the frontline platform that brings tasks, communications, and learning together, so every store visit ends with the right work in motion.
What is the best software for retail store audits?
The best software for retail store audits is YOOBIC for multi-location retailers that need every audit to end in assigned, verified action. It connects mobile checklists, photo validation, and action plans to training and communications in one platform. Other strong options fit narrower jobs, including Mitti for safety inspections, GoAudits for budget-conscious inspection programs, and Crunchtime Ops Execution for food safety. The right choice depends on whether you audit your own stores, inspect facilities, or check shelves in someone else’s stores.
What are the best retail store audit apps?
The best retail store audit apps are YOOBIC, Zipline, WorkJam, Mitti, Bindy, and GoAudits, and each suits a different need. YOOBIC suits retailers that want audits tied to tasks, training, and communications. Zipline and WorkJam suit teams led by communications or workforce needs, while Mitti, Bindy, and GoAudits focus on inspections. In any app you shortlist, look for offline mobile checklists, timestamped photo proof, automatic corrective actions, and live dashboards.
How do you audit a store?
You audit a store by checking it against defined standards, recording evidence, scoring the result, and assigning every failed item to an owner. Start by reviewing the store’s last scores and open actions before you arrive. Then walk the store as a customer would, score each area against clear criteria, and photograph anything you flag. Finally, assign each issue with a deadline, and confirm the fix with photo proof before the next visit.
What is a retail store audit?
A retail store audit is a structured, scored evaluation of a store against brand, operational, and regulatory standards. It uses consistent criteria and photo evidence to show what is happening on the sales floor. Retailers use audits to compare stores fairly, catch execution gaps early, and decide where field leaders should spend their time. A store visit is the wider event, which also includes coaching and follow-up.
Most stores already pass on cleanliness. In England, 77.8% of rated food establishments hold a hygiene rating of 5, and around 97% hold a 3 or better. Physical standards are not what separates a good store from a great one, which is why store compliance is rarely a cleaning problem.
Paperwork is.
That surprises people, so it is worth being precise about how inspectors treat records. A missing log and a completed log showing an uncorrected problem are not the same finding. Inspectors can treat them differently, and evidence of an uncontrolled hazard can lead to a more serious outcome.
INSIGHT
A missing record can be a documentation failure. A record showing an out-of-spec reading with no corrective action can show that a hazard was identified but not controlled. Inspectors may treat the latter more seriously, and affected food may have to be discarded depending on the circumstances.
Under the FDA model Food Code, date marking itself is a Priority Foundation provision, but inspection scoring and the treatment of missing records vary by state and local jurisdiction. Where a Priority Foundation item is out of compliance, the model code generally allows up to 10 calendar days for correction.
Now take a log showing cooked poultry held at 112°F for four hours with no action recorded. That indicates a serious time-and-temperature control failure. The food may need to be discarded, and the regulatory response will depend on the jurisdiction and circumstances.
Under the Food Hygiene Rating Scheme in England, Wales and Northern Ireland, environmental health officers score three elements. Confidence in Management is the element that reflects how effectively the business manages and documents food safety. The possible scores are 0, 5, 10, 20 or 30. Scotland uses a separate food hygiene information scheme.
Take a store with otherwise strong hygiene and structural conditions but gaps in its daily diary sign-offs. Those gaps can reduce an officer’s confidence in management and affect the overall rating, depending on the evidence available.
Now take a store with a chiller logged at 12°C for days and no service call recorded. That combination of an out-of-range reading and missing corrective action can materially worsen the assessment, even if the premises are visibly clean.
So the nine records below are not just an administrative chore. They provide evidence that can influence an inspection outcome and help show that food safety controls are working in practice.
1. Chilled and frozen temperature records
Temperature records are among the most commonly reviewed food safety records in grocery operations, and incomplete entries can make control harder to demonstrate.
In England, Wales and Northern Ireland, chilled food likely to support pathogen growth generally carries a legal maximum of 8°C. The Food Standards Agency advises 5°C or below as an operating target, which helps absorb defrost cycles and door openings. Scotland has separate temperature-control rules. In the US, the FDA model Food Code uses 41°F or colder for cold holding where adopted.
Frozen storage carries a harder rule in the UK. The Quick-frozen Foodstuffs Regulations set -18°C or colder, with display tolerance to -12°C. Measuring instruments in cold stores over 10 cubic metres must record at regular intervals. The law requires you to date those records and keep them for at least a year.
Chilled logs have no single statutory retention period. Many operators retain them for around 12 months as a practical benchmark to support traceability and demonstrate due diligence, but the appropriate period depends on the record and applicable requirements.
2. Hot holding records
Hot displays fail quietly, and the record is what proves you noticed.
UK law makes it an offense to keep hot food below 63°C. A defense allows a single period of up to two hours below that threshold. To use it, you must show the food was freshly cooked and the window held. That means logging a batch placement time, not just a temperature, which is why fresh counter checks fail on timing rather than on policy.
Under the FDA model Food Code, the equivalent hot-holding threshold is 135°F where adopted. Operations using Time as a Public Health Control instead of temperature control need a written procedure prepared in advance, with food marked or otherwise identified to show the required discard time.
3. Cooking, reheating and cooling records
This is where the biggest gap between practice and paperwork sits.
Under the FDA model Food Code, common cooking thresholds include 165°F for poultry, 155°F for 17 seconds for ground meats, and 145°F for 15 seconds for whole intact cuts. Reheating food for hot holding generally requires 165°F within two hours where the model code has been adopted.
In Food Standards Agency guidance for England, Wales and Northern Ireland, a commonly cited safe cooking combination is 75°C for at least 30 seconds, or an equivalent time-and-temperature combination. In Scotland, guidance commonly uses 82°C for reheating unless an equivalent validated process is used.
Cooling is the weak point. The FDA model Food Code cooling curve calls for food to cool from 135°F to 70°F within two hours, then to 41°F within six hours total. CDC field research in restaurants conducted in 2009–2010 found that 35% of observed cooling processes did not meet those parameters, and unmonitored food was more than twice as likely to cool too slowly. That evidence is useful operational context rather than a current grocery-sector benchmark.
Cooling logs routinely capture the first reading and omit the two-hour checkpoint. That can make compliance difficult to verify. Under the FDA model Food Code, certain reduced oxygen packaging operations require HACCP controls and related records, with record-retention requirements that can extend for at least six months.
4. Probe calibration records
A temperature record is only worth the accuracy of the instrument that produced it.
The FDA model Food Code specifies accuracy requirements of 1°C for food temperature devices and 1.5°C for ambient air devices. In UK guidance, calibration or accuracy checks should follow manufacturer instructions; where no frequency is specified, monthly checks against ice-point and boiling-point references are a common example of good practice.
Inspectors ask for calibration records because they undermine everything else. If nobody verified the probe, every temperature log it produced is open to challenge.
5. Date marking and shelf-life records
Two different obligations sit here, and stores often meet one and miss the other.
The label is the first. The FDA model Food Code §3-501.17 covers ready-to-eat foods held more than 24 hours. Staff mark them, then use, sell or discard them within seven calendar days. The day of preparation counts as day one. In the UK, food must not be sold after its use-by date; doing so can be an offence.
The validation is the second, and it is the one that gets missed. A store slicing cooked meats at a counter has to justify the shelf life it assigns. Depending on the product and process, validation can draw on historical data, shelf-life studies, predictive modelling and/or challenge testing, including where Listeria monocytogenes is a relevant hazard. Those protocols should be retained with the food safety system, alongside the date-check routines that reduce shrink in a grocery store.
6. Cleaning and sanitation records
The schedule is the record, and the sign-off is what makes it evidence.
Under the FDA model Food Code, food-contact surfaces in continuous contact with time-and-temperature control foods generally must be cleaned at least every four hours where the model code has been adopted. Staff should clean, sanitize and verify sanitizer concentration as appropriate.
UK operations commonly use a written master cleaning schedule covering surfaces, frequencies, suitable chemical agents, contact times and dilution ratios. A written schedule is strong practice, but it is not a universal standalone legal requirement in every operation.
Keeping verified cleaning records can help demonstrate that controls were implemented and may support a due diligence defence, but there is no universal one-year retention rule for all cleaning schedules.
7. Allergen and labeling records
The record here is not one document but three.
For prepacked for direct sale items, Natasha’s Law requires every package to carry the food name and a full ingredients list, with all 14 regulated allergens emphasized. The recipe and specification information behind those labels should be kept current and retained as part of the business’s food safety and labelling controls.
Loose counter-served food falls outside that labeling rule. Allergen information can be provided in writing or verbally. If a business relies on verbal information, customers must be clearly told how to obtain it, and the information provided must be accurate and consistent. A written allergen matrix is a common way to support that process, but it is not the only permitted format.
Staff training on allergen questions is the third. In the US, the person in charge must ensure staff answer allergen inquiries accurately. The 2021 FASTER Act added sesame as a ninth major allergen from January 2023.
8. Supplier, goods-in and traceability records
Traceability is one-step-back and one-step-forward, and some parts of it carry hard federal retention rules.
Traceability records should identify suppliers and business customers, the type and quantity of products, and transaction and delivery dates; batch or lot details can strengthen traceability where relevant. General food law does not set one universal retention period, so records should be kept for a period appropriate to the product, its shelf life and the circumstances, unless sector-specific rules set a defined period.
Three US records are stricter. Stores grinding raw beef keep daily grinding logs covering supplier establishment numbers, lot numbers, carryover material, and the times of production and sanitation.
Those logs run one year and stay at the store, because archiving them at head office is prohibited. Shellstock tags run 90 days in chronological order. Parasite destruction records for raw fish run 90 days beyond sale.
DEFINITION:
One-step-back, one-step-forward
The traceability standard requiring a food business to identify the immediate supplier of anything it receives and the immediate recipient of anything it supplies. For a retail store the forward step ends at the consumer, so the real obligation is proving the backward step through delivery records and batch codes.
9. Corrective action records
The one that decides how the other eight are read.
Corrective-action requirements depend on the process and regulatory framework. Under FDA model Food Code HACCP or variance provisions, written corrective-action procedures and records can be required when critical limits are not met. In the UK, Safer Food, Better Business uses an exception-based approach: staff sign off routine checks and record what happened and what was done when something goes wrong.
That exception-based design is the point. Nobody is asking for a perfect record. They are asking for proof that when something went wrong, somebody noticed and acted.
Why paper records fail
Fabricated or back-filled logs can leave patterns that raise questions during an audit or inspection.
Refrigeration temperatures normally fluctuate through the day because of defrost cycles, loading and door openings. A log showing identical readings at every check over an extended period may therefore warrant a closer look.
Other inconsistencies can also prompt questions, such as highly uniform entries across different shifts or records completed before the stated check time. None of these patterns proves fabrication on its own, but they can lead an auditor or inspector to look more closely at how records are being completed.
The deeper problem is that paper cannot prompt anyone. A clipboard records a breach. It does not tell the associate what to do about it, and it does not tell the manager it happened, which is the case for going paperless with digital checklists.
What makes a record hold up
A record that survives an inspection needs four things, and none of them are about the checklist.
It needs to prove who did the check and when. Capturing the user, the site, the exact timestamp and geofence coordinates at the point of work removes the argument entirely.
It needs to resist fabrication. Live-capture photo verification blocks camera roll uploads, so the image comes from the moment. A Bluetooth probe writing its reading straight into the task removes transcription altogether, which depends on the integrations sitting behind it.
It needs to link a failure to a fix. When a check fails, the corrective action should generate automatically, carry a named owner and a deadline, and require verification to close. That is the difference between a record that convicts you and one that defends you.
It needs to appear on demand. A manager should be able to show records on a tablet or export a dated report covering whatever period the inspector asks for, the same evidence trail a store visits and audits already generate. The mechanics are the same ones covered in our complete guide to store visits and audits.
“It gives us better visibility of who has and hasn't completed tasks. That includes compliance, with colleagues able to complete routine tasks such as daily temperature checks, health and safety checks and food safety checks all from the same handheld device.”
Gordon Macpherson, Group Productivity Director, Morrisons
Pret A Manger eliminated around 900,000 printed pages a year and now reports roughly 154,000 hours saved annually across checks and processes.
Boots reduced the time required for daily compliance checks by 78% after digitizing store checks and audits. Lidl France reports 98% cold-chain maintenance across its network of more than 1,500 supermarkets. Vitalia reports 50% less time spent on product recalls, cutting a manual process that previously took at least three days roughly in half.
Start with the corrective action
If you fix one thing, fix the ninth record rather than the first.
Most stores already take the temperature. Fewer can show what happened the day a reading came back wrong. That gap turns a good log into evidence against you. Closing it changes how every other record on this list reads.
Retention depends on the record, and several periods are set in law rather than by policy. In the UK, quick-frozen food temperature records carry a statutory minimum of one year, and Safer Food, Better Business diaries are kept for 12 months to support a due diligence defense. In the US, retail raw beef grinding logs are retained for one year and must stay at the store rather than head office, shellstock tags for 90 days in chronological order, parasite destruction records for 90 days beyond sale, and reduced oxygen packaging HACCP logs for at least six months. General food law does not set a single retention period for traceability records; businesses should keep them for a period appropriate to the product and circumstances unless sector-specific rules apply. Where no specific retention period applies, businesses should set a period based on their food safety system, product shelf life, traceability needs and local guidance; 12 months is a common practical benchmark rather than a universal rule.
What food safety records do inspectors ask to see?
Inspectors ask for the records that prove active control rather than good intentions. Common examples include chilled and frozen temperature logs, hot holding records with batch placement times, cooking and cooling verification, probe calibration evidence, date marking and shelf-life validation, cleaning schedules with supervisor sign-off, allergen information and labelling records, supplier and goods-in traceability with batch codes, and corrective action records. Environmental health officers may ask for recent temperature and monitoring records, but the period and frequency expected depend on the operation, risk profile, food safety system and local enforcement approach. Corrective action records are especially useful because they show what happened after a problem was identified.
What happens if a food safety record is missing?
A missing record can be a documentation failure, but the regulatory consequence depends on what the record relates to and the local enforcement system. Under the FDA model Food Code, date marking is a Priority Foundation provision, while local jurisdictions determine inspection scoring and how missing documentation is handled. In the UK, gaps in diary sign-offs can reduce an officer’s confidence in management and affect the overall hygiene rating. A record showing an out-of-specification reading with no corrective action may be treated more seriously because it indicates that a problem was identified but not controlled.
What can make a temperature log look unreliable?
Auditors and inspectors may look for inconsistencies that suggest a log does not reflect normal operating conditions. Refrigeration temperatures typically vary through the day, so repeated identical readings over a long period may warrant closer review. Entries completed before the stated check time, unusually uniform records across different shifts, or other inconsistencies can also raise questions. These signs do not prove a record was falsified; they are reasons to verify the underlying process and evidence.
Produce is the only department where the two things you are measured on pull in opposite directions.
Empty space costs sales. Full space costs margin. Unlike ambient grocery, you cannot settle the tension by holding more stock, because produce decays whether it sells or not.
Research on perishables across 27 stores from three large European retailers shows that availability and waste should be optimized together, not maximized independently. The study’s Efficient Frontier estimates the minimum waste required at any given on-shelf availability (OSA). In the ECR model, a 98% OSA target for perishables would imply about 4.5% waste even under ideal execution, so retailers typically set lower OSA targets for perishable items.
INSIGHT
There is no universal 95% ceiling for fresh availability. The evidence supports choosing an OSA ‘sweet spot’ by category and item economics rather than applying a flat 98% or 99% target across the department.
So the job is not to maximize availability. It is to make good decisions inside a fixed trade-off, several times a day. Here are the seven that matter.
1. When to walk the department
Most produce shrink is influenced by how often somebody looks at the display. ECR Retail Loss’s global study found that nearly all participating retailers inspect fresh-product expiration dates every day; one retailer reported checking three times daily.
The morning cull is the logical anchor: inspect quality, rotate older stock forward, remove decay and check dated lines before peak trading. The exact duration depends on assortment, store size and whether checks are manual or system-directed.
Additional checks should be triggered by trading peaks and product risk rather than a fixed industry-standard timetable. The ECR study found more than half of retailers use fixed schedules by category, while many use in-house apps to direct colleagues to items most likely to expire.
Fresh products are checked daily at nearly all surveyed retailers
Nearly all participating retailers inspect expiration dates on fresh products every day. More than half use fixed schedules by category, while many others use apps or analytics to focus labor on items with the highest expiry risk.
ECR Retail Loss’s 2024 global study
When payroll tightens, this is the first thing cut. The consequence is not only waste. Decayed product left on display still registers as available stock. The dashboard reports in stock while the shopper sees nothing worth buying.
2. Restock, mark down, or remove
Every item you pick up gets one of three answers, and the order you ask the questions in matters.
The first test is pathological. Active rot, visible mold, tissue breakdown or punctured skin means immediate removal. Fungal spores and soft rot travel across an open display through the air and on hands.
The second test is cosmetic and commercial. Sound product that meets specification goes back to the fixture. Product that is still safe and saleable but has limited remaining life or minor cosmetic deterioration may be a markdown candidate, subject to the retailer’s quality and food-safety policy.
Markdown practice varies widely by retailer, category and store. ECR Retail Loss found many retailers discount on the day of expiry or the day before; most use a single markdown step, while some use two steps such as 30% followed by 60% to 70%. Aldi UK publicly states that it offers up to 75% reductions on fresh produce, bakery and chilled products near the end of shelf life.
Either way the call is expert judgement. The system’s job is narrower. Put the decision in front of the right person at the right time, attach the sell-through data, and record the outcome.
3. How much to build the display
Abundance sells produce. Abundance is also how produce becomes waste, and the arithmetic is unforgiving.
A bulk display can hold several days of demand if its capacity is set by visual abundance rather than sell-through. That leaves more product exposed to ambient conditions and customer handling for longer than necessary.
Stacked several layers deep, the bottom fruit takes compressive load, bruises internally and rots. The associate is caught between passing a merchandising audit and controlling shrink.
There is a way out that keeps the look. Stepped risers, tiered inserts and false-bottom bases can create visual abundance with less product physically on the fixture. They avoid unnecessarily deep layers, reducing the amount of fruit exposed to handling and compression at any one time.
4. Front the oldest stock, not the newest
Rotation looks like a stocking task. It is really an availability decision, because bad rotation strands sellable product until it stops being sellable.
Done properly on a bulk table, rotation takes four steps. Lift the older stock off, clean the deck, place the new stock underneath, then return the older stock to the front. The operating principle is first-expiry, first-out (FEFO): stock with the shortest remaining life should be easiest for the shopper to take first.
When new stock is placed on top without rotation, older product becomes trapped under poorer airflow and more physical load. For ethylene-producing commodities, accumulated ethylene can also accelerate ripening. The result is older stock deteriorating out of sight while newer stock sells first.
DEFINITION:
First-expiry, first-out (FEFO)
A rotation method that positions the stock with the shortest remaining shelf life to sell first. In produce, it means moving older saleable product forward or upward before adding newer stock behind or underneath it.
Shopper behavior makes rotation matter too. A 2024 Marketing Science field study on fresh meat found that moving the oldest vintage to the most visible shelf position increased its choice share by 24 percentage points. The category differs from produce, but the operational lesson is clear: physical placement strongly influences which dated stock sells first.
5. What to record when something is thrown away
Unrecorded waste is worse than waste, because it corrupts the system that decides your next order.
The loop runs like this. Five punnets of berries spoil and go in the bin without being scanned. The inventory record still shows them as available. The replenishment algorithm reads that stock on hand and suppresses the next order, which is why expiration date tracking keeps surfacing in grocery operations conversations. The line then sits out of stock until somebody runs a manual count.
A global ECR Retail Loss study covering 19 retailers found write-off systems used between 2 and 14 reason codes, with a median of six. The study also found that codes can mix two different things: why an item was written off and where it physically went.
That matters because a single field can force colleagues to choose between a cause such as damage or expiration and a destination such as donation, garbage or recycling. Two-dimensional capture – reason plus destination – gives buyers a diagnosis they can act on rather than only a waste total.
6. Whether a gap needs a task or a phone call
Not every empty space is a supply problem, and most of them are not.
A classic GMA out-of-stock study found that around 72% of shelf stockouts were caused within retail operations: 25% by shelf-replenishment issues and 47% by store ordering, versus 28% upstream. That does not mean every gap has stock in the building, but it shows why store execution should be checked before escalating a supply problem.
That distinction decides the response. Stock in the building is a task. Stock that never arrived is a supply chain conversation, and pushing it into a store task list wastes the walk.
Morrisons removed the detection step at shelf level. The chain runs between 400 and 600 AI cameras per store. When one detects an empty shelf, the system generates a replenishment task and routes it straight to the colleague responsible for that department.
“No one is watching the feed. No one has to decide whether to act. The condition is met, the task fires, and the store team gets a clear action to complete. The human role is the response, not the monitoring.”
Gordon Macpherson, Group Productivity Director, Morrisons
7. Whether the store next door made the same call
The last decision is not made in the store, and it improves the other six.
Research across 27 European stores compared actual waste with an Efficient Frontier benchmark that controls for factors such as demand, case pack size, shelf life and target OSA. The five stores with the highest improvement potential had approximately 72% more waste than their benchmark; the five with the lowest improvement potential had about 17% more.
The researchers concluded that, after structural factors are controlled for, a meaningful share of the remaining variation is likely to come from store replenishment and execution: procedures, compliance, rotation and replenishment decisions. That is the part head office cannot diagnose well without evidence from the floor.
Photo capture at the point of work closes that gap. A before and after image, timestamped and attributed, turns a district conversation from opinion into something both people can see, and gives store visits and audits something concrete to work from.
What sits underneath all seven
One structural factor explains a large share of variation in perishable waste, and store teams cannot fix it on their own.
Researchers at Eindhoven University of Technology define Fresh Case Cover (FCC) as case pack size divided by average demand during the store shelf life: FCC = case pack size / (average daily demand x store shelf life). A value above 1 means the case quantity exceeds expected demand over the store shelf life, making waste structurally likely even with good execution.
Across 17,093 item-store combinations in three fresh categories, FCC explained 42% of the variation in waste. In the peer-reviewed model, increasing store shelf life by one day reduced modeled waste by 43.1%, while unpacking in the distribution center so stores could receive smaller quantities reduced modeled waste by 34.8%.
So if your best store still runs high waste on a line, check the case size before you review the team. The seven decisions above govern the rest.
Where to start
Protect the checks first. ECR’s global study found nearly all participating retailers inspect fresh-product expiration dates daily, with frequency and labor directed by category risk, store conditions and system signals.
Then give the three-way decision somewhere to live, so restock, mark down and remove get recorded rather than remembered. Separate cause from destination in the waste log so buyers can act on it. Finally, compare stores and ask why two teams made different calls on the same morning.
The same decisions apply to bakery, deli and prepared foods. Produce just makes the trade-off between availability and waste more visible than anywhere else in the store. For the wider picture, see our guide to grocery store operations.
On-shelf availability is the percentage of products physically present and sellable on the shelf at the moment a customer looks for them, and it is the inverse of the out-of-stock rate. It differs from inventory availability, because a product sitting in the backroom counts as in stock in the system while being out of stock for the shopper in the aisle. A classic GMA study found 72% of shelf out-of-stock causes were within retail operations – 25% shelf replenishment and 47% store ordering – rather than upstream. In fresh departments the measure is stricter still, since produce that is present but past acceptable quality is not genuinely available even though it sits on display.
How to measure on-shelf availability?
On-shelf availability is measured by comparing the products that should be on the shelf against what is physically there, expressed as a percentage of the SKUs checked. Common methods include manual gap or quality checks, system-based inference that flags SKUs showing no sales while inventory reports stock on hand, and automated shelf monitoring using cameras or computer vision. Manual checks are particularly important in fresh because they can assess quality as well as presence. ECR Retail Loss found nearly all surveyed retailers check fresh expiration dates daily, while many use apps or analytics to direct that labor toward the items with the highest risk.
What causes on-shelf availability issues in retail stores?
A large share of on-shelf availability failures arise inside retail operations rather than upstream. In the classic GMA study, 72% of shelf out-of-stock causes were at retail: 25% shelf replenishment and 47% store ordering. Common store-level causes include delayed replenishment during peak trading, backroom stock nobody has worked, poor rotation that strands older product behind newer deliveries, and unrecorded waste that leaves inventory records artificially high so the replenishment system suppresses the next order. In produce, quality adds another failure mode: product may be physically present but no longer saleable. Case pack size is a further structural driver because a high Fresh Case Cover increases waste risk before store execution is considered.
How can retailers reduce food waste while maintaining high on-shelf availability?
Retailers can protect both availability and waste by setting an item- or category-specific OSA sweet spot rather than a universal 95%, 98% or 99% target. ECR modelling across 27 stores found that differentiating service levels – lowering OSA by 3 percentage points for slow movers while increasing it for fast movers – reduced modeled waste by 12.0% in the Waste Less scenario. In the peer-reviewed study, one extra day of store shelf life reduced modeled waste by 43.1%, and unpacking in the distribution center to allow smaller store quantities reduced it by 34.8%. Inside the store, daily fresh-date checks, disciplined rotation, accurate waste capture and display designs that avoid unnecessary depth support the same goal.
Portrait Of Female Owner Of Fashion Store Using Digital Tablet To Check Stock In Clothing Store
Most lists of retail store operations efficiency metrics start in the same place. Sales per square foot, sales per labor hour, conversion rate and inventory turnover all appear. They show how a store turns space, staff and stock into revenue. Those numbers matter, but they only describe the result.
They don’t show whether the store did the work behind it. In one store, a promotion goes up three days late. In another, the team never saw the update, or built the display incorrectly. Both stores miss their targets, and the sales report can’t tell you why.
Execution metrics fill that gap. They measure whether stores received, understood, completed and proved the work head office asked for. This guide covers the 10 that matter most and how to calculate each one. It also shows how to benchmark them when no industry standard exists.
DEFINITION:
Retail store operations efficiency metrics
Measures of how quickly, accurately and consistently store teams complete the work head office asks for. Sales metrics show what a store earned, while execution metrics show whether stores did the work behind those results.
Why don’t sales KPIs explain store performance?
Sales KPIs are essential for understanding how each store is trading. Our guide to KPIs in retail covers them in detail. However, they arrive after the fact. They show that a store underperformed last week, but rarely what happened on the floor to cause it.
As a result, district managers visit stores to find out, and head office waits for their reports. That delay is expensive, because many sources of lost sales start inside the store.
A product sits in the stockroom instead of on the shelf. A price tag doesn’t match the promotion. A display goes up after the busiest weekend.
$742.5B
Of global inventory distortion traced to store operations, more than supply chain or manufacturer issues.
IHL Group, Fixing Inventory Distortion, 2025
The same study puts product location failures at $145.2 billion and customer service inadequacies at $165.6 billion. A sales report can show the impact of problems like these, but not the cause. We unpack the wider cost of these misses in the retail execution gap.
Execution metrics measure the work itself, so problems surface while there’s still time to fix them. Put simply, sales KPIs tell you where to look, and execution metrics tell you what went wrong.
How execution metrics fit together
The most useful execution metrics follow the path a directive takes through a store. First, the team has to receive and understand it. Next, they need the skills to carry it out. Then they complete the work efficiently, prove it meets the standard and keep that standard in place.
Each step can break down on its own. A store can complete every task while half the team never read the brief. Similarly, a store that finishes tasks on time but fails audits is doing the work without meeting the standard. That’s why the 10 metrics below work best as a set.
What are the most important retail store operations efficiency metrics?
The metrics below follow that chain in order, from the first message a store receives to consistency across your network. Each includes what it measures, how to calculate it and what it tells you.
1. Communication read rate
Communication read rate measures the share of targeted store employees who opened or confirmed a directive. It’s the first signal that a message reached the people doing the work, not just the store manager’s inbox.
Calculation: (team members who read or acknowledged the message ÷ team members it was sent to) × 100
A low read rate is an early warning. It points to messages sent through the wrong channel, or at the wrong time for shift patterns. Frontline employees rarely sit at a desk. Mobile delivery with read confirmation gives you a reliable number instead of an assumption.
2. Training completion before launch
This metric tracks the share of employees who finished required learning before a campaign, product or process went live. Many teams track total course completion instead, but timing matters more. Training completed a week after launch doesn’t help the first week of execution.
Calculation: (employees who completed required training before go-live ÷ employees required to complete it) × 100
Review it alongside audit results for the same initiative. When stores with lower training completion also score lower on that audit, you’ve found a training gap. Keeping learning and task data in one place makes the two easy to compare.
3. Task completion rate
Task completion rate is the share of assigned tasks that store teams complete by the deadline. It’s the most widely used execution metric, and the clearest view of whether the plan reached the floor.
Calculation: (tasks completed by the deadline ÷ tasks assigned) × 100
Count on-time completion only. Late tasks still matter, but they belong in time to execute, below. For more on structuring the work itself, see our guide to retail task management.
90 to 95%
Task completion across more than 900 Pilot Company locations, up from limited visibility under manual processes.
Time to execute measures how long stores take to complete a directive after head office publishes it. It’s the store-level version of cycle time. It matters most for promotions, recalls and price changes, where every day of delay has a cost.
Calculation: time of verified completion minus time the directive was published, reported as a median across stores
Use the median rather than the average, because a few very slow stores distort an average. Then look separately at your slowest 10% of stores. Those are the locations where a promotion is still missing when customers arrive.
Speed and proof work together. The Kooples required stores to submit photos of visual merchandising displays for approval. Within ten months, compliance doubled and 90% of merchandising updates were live within 48 hours.
5. Labor hours per task
Labor hours per task measures how much store time a routine process takes. Think of a price change, a planogram reset or a delivery. Where sales per labor hour shows output, this metric shows where the hours actually go.
Calculation: total labor hours spent on a task type ÷ number of times stores completed it, compared with the expected time for that task
You’ll need labor data from your workforce management system alongside task data. Compare results across stores before changing any standard. A store that takes twice as long on the same reset is worth a closer look first.
Reclaimed time adds up quickly at scale. Michaels saved 223,000 hours a year across 1,350 stores after moving to digital task management.
6. Evidence submission rate
Evidence submission rate is the share of completed tasks that include the required proof. Common proof includes a photo, a scanned barcode or a signed checklist. A task marked complete without evidence is a claim, while a time-stamped photo is something a manager can check.
This metric protects the accuracy of every other one. When evidence rates are low, treat task completion with caution. It reflects what stores reported, not what they did.
7. Rework rate
Rework rate measures the share of submitted work sent back because it didn’t meet the standard. It shows how much time managers and store teams lose correcting work already marked done. Its flip side, first-time approval rate, is a more motivating way to share the same number with store teams.
Calculation: (submissions returned for correction ÷ total submissions reviewed) × 100
A rising rework rate points to unclear instructions. So before retraining the team, check the brief. Clear visual references and a short checklist fix more than a follow-up phone call.
8. SOP adherence rate
SOP adherence rate tracks how consistently stores complete routine procedures on schedule. That includes opening and closing routines, safety checks, cleaning schedules and temperature logs. Unlike one-off directives, these recurring standards slip easily when a store gets busy.
Calculation: (scheduled checklists completed on time ÷ scheduled checklists due) × 100
Break the results down by checklist type and day of the week. A store that misses weekend closing checks but never skips opening routines has a scheduling problem, not a discipline one. Michaels holds this standard through daily customer readiness walks, and its stores reached 98% compliance on them.
9. Audit pass rate
Audit pass rate measures the share of store visits and audits that meet your pass threshold. Most retailers score each audit as a percentage of points achieved, then set that threshold. Weighting critical items more heavily stops a store passing on presentation while failing on safety.
Calculation: (audits scoring at or above the pass threshold ÷ audits completed) × 100. Corrective action closure rate equals (issues fixed by their deadline ÷ issues raised) × 100.
Track both numbers. The pass rate shows how many stores fall below the line. Corrective action closure shows whether store teams actually fix what audits find. For more on running audits well, see our complete guide to retail audits.
700 basis points
Increase in Mattress Firm’s safety and compliance audit scores over two quarters, after standardizing a single audit tool.
YOOBIC customer story, Mattress Firm
10. Consistency variance across stores
Consistency variance measures the spread between your strongest and weakest stores on any metric above. Network averages hide problems. A 90% average can mean every store sits at 90%. It can also mean most sit near 100% while a few fall far behind.
Calculation: average result of your top-quartile stores minus average result of your bottom-quartile stores, for the same metric and period
Teams with analyst support can use the coefficient of variation instead, which divides the standard deviation by the average. Either way, this is the metric that turns execution data into decisions. It tells district managers which stores to visit next. It also tells head office whether a standard needs support or revision.
Visibility across the whole network is what makes this possible. Lidl raised company-wide compliance by 11% after switching from periodic spot checks to real-time monitoring.
“Before YOOBIC, it was difficult for us to understand the situation of our supermarkets across the country. Now we are able to monitor compliance in real time and understand our strengths and areas for improvement.”
Thibaut Lièvre, Head of Sales Organization, Lidl France
How do you benchmark store execution across locations?
Manager using digital tablet on blurred store as background
Published benchmarks for execution metrics are rare. Most industry research covers sales, shrink and stock levels rather than the work behind them. For time to execute, rework rate and consistency variance, no published industry benchmark exists at all.
Even where figures exist, they rarely compare cleanly, because store formats, task volumes and definitions differ between retailers. The customer results in this guide are useful reference points from real store networks, not industry standards.
INSIGHT
INSIGHT: Your top-quartile stores are your most relevant benchmark. They prove what’s achievable with your products, your systems and your standards, which no industry average can do.
Here’s a simple way to set targets across your network:
Establish a baseline first. Track each metric for four to six weeks before setting a target. That way, you’re working from real patterns, not a single week.
Rank stores by quartile. Group stores by result for each metric. Where formats differ, such as flagship and convenience stores, compare like with like.
Set the target at top-quartile performance. Use the average of your best-performing quarter of stores as the target for the rest of the network.
Review the trend, not the snapshot. Look at movement over rolling four-week periods, so one unusually busy week doesn’t trigger the wrong response.
Over time, this approach raises the standard from within. As bottom-quartile stores improve, the top-quartile target moves up with them.
Connecting execution metrics to commercial results
Execution metrics become most valuable when you read them alongside sales data. On their own, they show whether stores did the work. Combined with performance data, they show which work actually moved the numbers.
Academic research supports the link. A 2026 study in the Journal of Business Logistics tracked around 24,000 products across 11 grocery stores. It found that performing an inventory audit led to an 11% store-wide sales lift.
This is where retail execution and trading results meet. For example, if stores with lower audit scores also convert fewer customers, district managers know where to visit next. At Michaels, task completion rates increased by 30%, and redirecting time to customer-facing work generated $1.8 million in incremental revenue. Read the Michaels case study.
AI now closes that loop faster. Store Manager Copilot interprets operational and performance data together, then recommends specific actions for store teams to review and accept. Store managers track each action to completion, then look back to see whether it shifted the number.
Meanwhile, head office sees which recommendations stores accept, skip or action, and which stores turn them into sales uplift. At Hugo Boss, putting those recommendations in store teams’ hands saved 25% of their administrative time.
3.2%
Incremental revenue at Hugo Boss, driven by AI-recommended actions adopted at store level through Store Manager Copilot.
YOOBIC customer story, Hugo Boss
Where to start with execution metrics
You don’t need all 10 metrics on day one. Instead, start with the ones that match your biggest current problem.
If promotions land late, start with time to execute. If standards vary between stores, start with audit pass rate and consistency variance. If you’re not yet sure where the problem sits, start with task completion rate and evidence submission rate.
Next, check where the data comes from. Metrics built on spreadsheets, emails and phone calls are slow to collect and hard to trust. By contrast, digital tasks, in-app audits and read confirmations produce the same numbers for every store as the work happens.
YOOBIC’s task management captures completion, photo evidence and approvals as store teams work. The metrics are ready without extra reporting. For the wider picture, including the barriers that hold stores back, read our guide to operational efficiency in retail.
The goal isn’t more reporting. The goal is knowing whether the plan reached every store, and what to fix when it didn’t.
What metrics are used to measure operational efficiency?
Retail operators measure operational efficiency with task completion, time to execute, labor hours per task, rework and audit pass rates. Together, these show how quickly stores complete work, how much time it takes and whether it meets the standard. Sales per labor hour shows the commercial result, while execution metrics show whether stores did the work behind it.
Can you give me some examples of operational metrics?
Common retail operational metrics include task completion rate, time to execute, evidence submission rate, SOP adherence and consistency variance. Task completion rate shows the share of tasks finished by the deadline. Time to execute tracks how long stores take to complete a directive. Evidence submission rate shows how many completed tasks include proof, such as a photo. SOP adherence tracks routine checklists, and consistency variance shows the gap between your strongest and weakest stores.
What are efficiency metrics?
Efficiency metrics measure how much output you get from the time, labor and money you put in. In retail store operations, they include labor hours per task, time to execute and rework rate. Together, they show how quickly and accurately store teams complete work. Unlike sales metrics, they show the effort behind results, so they help explain why two similar stores perform differently.
How to calculate efficiency in operations?
Calculate operational efficiency by dividing output by the input used to produce it. Then compare the result with a target or your best performers. In stores, labor hours per task divides hours spent on a task type by how often stores completed it. Time to execute and rework rate add speed and quality. Together, they show whether faster work still meets the standard.
What are the 5 key performance indicators in operations?
Five core store operations KPIs are task completion rate, time to execute, labor hours per task, audit pass rate and consistency variance. No universal list exists, but these five cover completion, speed, labor cost, standards and consistency across locations. Together, they explain the store-level causes behind sales results.
A retail operations leader once asked her stores why they kept turning away click and collect orders. The answer came back fast, and she shared it on Frontline Fridays.
“It takes us away from the customer, and we don't want to give away our best product. We want customers who walk in to get it.”
Rachel Williamson, Frontline Fridays
That’s the whole problem in one exchange. Not a technology gap, and not a training gap. Her teams understood the order perfectly well. They just knew what filling it would cost them, and nobody upstream had accounted for that.
Her stores were not being difficult. They were being rational.
Gen Z shopping trends get written up constantly. The behavior is well documented by now. What almost nobody writes about is the second half. That’s where a shopping habit becomes a job somebody has to finish before close.
So here are six trends. More usefully, here’s what each one puts on your floor, generally around four o’clock on a Thursday.
What are the typical shopping habits of Generation Z?
Gen Z shoppers move between digital and physical channels inside a single purchase. They discover products on social platforms and research through AI tools and marketplaces. They check prices in your aisles, then buy across both channels. Nearly all of them still shop in physical stores, which makes store execution central.
1. Discovery has left the search bar
Between 38% and 40% of Gen Z consumers start product searches on YouTube or TikTok rather than a search engine. That comes from Jungle Scout’s Q1 2024 panel of 1,000 US adults.
So discovery now happens in a feed you don’t own, on a schedule you don’t set. The creator driving it is someone you have never heard of.
That has an obvious marketing consequence. It also has an operational one, and that gets discussed far less.
On the floor: a customer asks for a product by a name your team has never heard. It came from a video your team has never seen. They will happily show you the video. Nobody briefed your associates, because there was nothing to brief. The demand did not exist on Monday. It very much exists now.
2. The phone is a second opinion in the aisle
Your shelf edge is no longer the last word on price. Around 62% of younger consumers compare prices across at least three retailers before buying. That’s PYMNTS Intelligence, census-balanced, 2,485 US consumers.
All of this happens while they stand in your store, holding your product.
On the floor: your associate is in a conversation with someone better informed than they are. The customer can see a competitor’s price and the review average. They can see whether a cheaper version ships tomorrow. That phone updated four seconds ago. Your associate’s handheld updated overnight. This isn’t a service problem. It’s an equipment problem.
3. They buy with the resale value already priced in
Resale has stopped being a niche. GlobalData’s 14th Annual Resale Report for ThredUp landed in April 2026. It projects the US secondhand apparel market at $78.8 billion by 2030, and puts 71% of that growth on Gen Z and millennials.
The behavioral shift matters more than the market size. A growing share of shoppers weigh what they’ll get back for an item later. The purchase and the eventual resale are one decision.
On the floor: condition becomes commercial. Tags, packaging and handling now shape a purchase that once hinged on fit and price alone. Somebody is checking whether the box has been opened, because a pristine box is worth more later. That scuffed one on the end of the shelf is a markdown you haven’t taken yet.
4. They arrive with a spec, not a question
AI has moved from novelty to research layer. Colliers’ 2026 retail research puts AI agent use at 19% of consumers today, rising to 46% by the end of this year.
Shoppers now arrive having asked an assistant to compare four products and summarize the reviews. They have already ruled out the ones with known defects. They are not browsing. They have a shortlist.
On the floor: the customer knows the model number, the alternatives, and roughly what it should cost. They are not asking whether you stock it. They are asking which aisle. Your associate knows what was on the task list. That asymmetry is not new, but the gap has widened fast, and it shows up as hesitation at the exact moment the sale gets decided.
5. They actually like your store
This is the part most Gen Z coverage gets backwards.
McKinsey and ICSC surveyed 3,004 US consumers for their April 2026 report. Gen Z and millennial respondents were significantly more likely than older cohorts to shop both online and in store. Shopping mostly online was not the leading method for any generation, in any category.
Earlier ICSC research found 97% of Gen Z shop at brick-and-mortar stores. Another 76% say physical stores are more enjoyable than shopping online. And 67% expect to make most of their purchases in stores five years from now. More than 40% say experiential retail makes them likelier to shop with a retailer.
So the store is not being abandoned. It gets visited on purpose, by people who did their homework first, and some of them will travel a long way for it. When a store becomes the thing people have decided is worth the trip, the queue outside is a marketing win and an operations problem arriving at the same moment.
On the floor: they came in for a reason, and the reason is usually specific. To see the color properly. To try the fit. To take it home today. Nobody makes a special trip for a maybe. Each of those reasons depends on the product being present, correct and findable, which puts a surprising amount of weight on an ordinary Tuesday.
6. The return was planned before the order shipped
Bracketing is standard practice now. NRF and Happy Returns found that 51% of Gen Z shoppers order multiple sizes or colors intending to send most back. Among Boomers it’s 24%. Gen Z shoppers aged 18 to 30 averaged 7.7 online returns in twelve months, more than any other generation.
Around 19.3% of online sales came back in 2025. In apparel it runs higher still.
Those returns land somewhere physical. Asked to rank favorite return locations, 42% name the retailer’s own store. The UPS Store leads at 59%, and USPS follows at 49%. So the store is not winning returns. It still absorbs an enormous number of them.
On the floor: returns arrive in carrier bags at the service desk during the after-work rush, which is also when walk-in traffic peaks. Three dresses go back, one stays. Each item needs checking, processing, and getting back into sellable condition. None of it was on the plan for the day, and all of it happens at the busiest counter in the building.
The same journey, mapped by an economist
Those six trends were assembled from survey data. It’s worth seeing them described from the outside, by someone who wasn’t looking at a shop floor at all. Richard Lim, CEO of Retail Economics, opened our Retail Excellence Forum in London by comparing two customer journeys, stage by stage. His mother’s, and her granddaughter’s.
Full transcript
Richard Lim, Retail Economics, at the YOOBIC Retail Excellence Forum, London, 1 October 2025. Lightly edited for clarity.
What makes it so difficult for consumers, and for retailers as well, is that the customer journey has changed so much over the last 30 years. My teenage years of walking around Burton’s in my local town center look very different from Gen Z’s today. But at the same time, for some consumers, the customer journey hasn’t changed hardly at all.
It’s made me think about my mum. She was 80 this year. If I think about the way my mum’s customer journey has changed in the last 30 years, or 50 years, it hasn’t changed at all.
She’ll be in front of the TV, watching something, and she’ll get served an advert. It might inspire her to go into M&S. Touch and feel. She wants to have that experience, to touch and feel, try things on. She’ll then probably go into John Lewis to compare some prices, and again she wants that physical experience in store. And then it gets neatly folded up into a paper bag. She hops on the bus and she goes home.
That customer journey looks very different from the customer journey of her granddaughter.
For her granddaughter, for the three hours a day she spends on TikTok, she’ll be scrolling through and she might see something that she likes, and she might go straight through to TikTok Shop to buy it within three clicks. But she’s a Gen Z. She still wants that physical environment. That physical experience for her is in a flagship destination. She wants to go to Leeds Trinity, Birmingham Bullring. She wants to go to one of the Westfields. She wants to immerse herself in that experience, before she then inevitably gets her phone out while she’s in store.
She searches for different options. She goes to Google, and we might give her an AI Overview. That AI Overview encourages her to go to a marketplace to look at different sites, before she goes onto her ChatGPT, where she’s created a stylist app, and she’s looking for different styles and whether they suit her particular style, before she goes onto Instagram for further social approval.
And then when she gets home, watching Love Island on demand, she gets served a personalized ad that sends her through to M&S. She’s a Gen Z, so she buys three dresses with the intention of keeping one of them. She then picks them up at the click and collect destination near where she works, before taking pictures of herself on TikTok, and then returning the others to a locker on the way home, before she sells the dress that she bought in about six weeks on Vinted, because you can get the money back and buy something new.
That variability of the customer journey, we’ve never had before. We’ve never had before.
Now count what that journey puts on a store. A flagship visit that needs the product present and somebody who can talk about it. Three dresses ordered with two already destined to come back. A click and collect pickup near her office. A return dropped at a locker. One sale, four separate pieces of physical work, spread across at least two locations and six weeks.
What is phygital retail?
Phygital retail describes shopping that moves between physical and digital channels inside a single purchase. A customer researches online, buys on an app, collects in store, and returns through a locker. For store teams, it means online activity keeps converting into physical work that someone on the floor completes.
Most definitions stop at the customer experience. They describe how connected the journey feels. That framing helps marketing teams and does very little for anyone running stores.
The part that matters operationally is the handover. Every phygital retail journey contains a moment where digital demand becomes a physical task with somebody’s name on it. Someone picks the order. Someone staffs the flagship. Someone processes the return.
What is in-store fulfillment?
In-store fulfillment is the practice of using store stock and store staff to complete online orders. It covers picking and packing from the sales floor, handing over click and collect orders, and shipping from store. Returns processed at the counter belong to it too. The store becomes a fulfillment point, not only a place to shop.
1 in 4
Online orders now fulfilled by a physical store.
Colliers National Retail Research, 2026.
The volume is no longer marginal. Colliers’ 2026 research reports that one in four online orders is now fulfilled by a physical store. It also finds 85.1% of US retail sales still flowing through stores, and 71% of retailers planning to expand their footprint.
Two numbers explain why that work goes wrong so often.
The first is inventory accuracy. Auburn University’s RFID Lab measures exact-match SKU accuracy in barcode-managed stores at 55% to 65%, averaging near 63%. The ECR Retail Loss Group finds more than 60% of SKU records in a discrepancy state at any moment. Your app tells the customer the item is available. Your record of that item is right about six times in ten.
63%
Average exact-match SKU inventory accuracy in barcode-managed stores.
Auburn University RFID Lab.
The second is what happens next. Research in Manufacturing and Service Operations Management found initial ship-from-store pick success running between 35% and 60%. Pick failure rates reached 20% across multi-stage fulfillment. Forrester found that 22% of US online adults say retailers frequently cancel their pickup orders.
Every failed pick sends an associate on a search loop through the backroom, the returns desk, and the misplaced stock on the floor. That time comes out of the same day as everything else.
The real gap is timing, not effort
Here’s the structural problem underneath all six trends. It also explains why store teams look slow when they are not.
Store labor gets locked well in advance. The Shift Project, run out of Harvard Kennedy School and UC Berkeley, surveyed 30,000 employees at 120 of the largest US retail and food service firms. Two-thirds receive schedules with less than two weeks’ notice. About a third get less than one week.
In Fair Workweek jurisdictions, large employers must post schedules 14 days ahead. Those include New York City, Seattle, Chicago, Philadelphia and Oregon. Changing a posted schedule inside that window triggers predictability pay.
So your roster is fixed a fortnight out.
Meanwhile a flash promotion, an app-exclusive discount, or a creator posting about your product runs on a cycle measured in hours. Operators consistently describe notice windows of one to three days. That side of the mismatch is reported rather than formally surveyed, so treat the number loosely and the pattern seriously.
Two clocks, in the same building, running at completely different speeds.
The sharpest version of this is a product going viral overnight. It happens at eight in the evening, after the team has gone home. By opening time the customers are already planning their visit, and the store is working from yesterday’s forecast and the usual staffing plan. Stock, prep, queue management and the questions associates field all day have all changed, and nobody on shift has been told.
INSIGHT
Store labor is planned two weeks out. Digital demand moves in hours. The gap between those two clocks lands on whoever is working that shift.
Fixed labor on one side. Variable, unpredictable demand on the other. This is the same discipline that sits behind consistent retail execution across a store estate.
You can’t forecast the spike. You can forecast whether you could absorb one.
Nobody predicts which video takes off. That isn’t a solvable problem and it’s a waste of time treating it like one.
What is solvable is whether a store has any room when it happens. Capacity is forecastable in a way that virality never will be, and it’s the part almost nobody works on.
Three things create that room.
Shrink the ordinary week
A store working through an unfinishable list has no absorption at all. Every surprise displaces something, and the manager makes that trade under pressure with no information. Morrisons cut weekly task volumes from between 80 and 100 items to around 10 targeted actions per manager. That’s the difference between a list nobody can finish and a day with slack in it, and slack is exactly what an unpredictable Thursday eats into.
Worth being honest about the catch. Software can show you which work is low value. Somebody upstream still has to agree to stop sending it.
Make readiness visible before you need it
“Is this store ready” should be answerable in advance, not discovered at the till. Task completion, audit history and training records already tell you which sites are carrying the most unfinished work and which ones are thin on a product category.
Training completion is the underrated one. A store sitting at 40% on a category is a store that will fumble the questions when something in that category goes viral. You can see that today rather than on the day it costs you.
The in-the-moment version matters more. When product information is searchable on the device in an associate’s hand, they can answer a question nobody briefed them on. That’s a standing capability rather than a standing instruction, and it’s the only kind that survives contact with something genuinely unexpected.
Give the floor a route back
The first store to hit the surge works out what actually helps. Somebody moves the display, changes the queue, or finds the stock in the back. Store twelve should not have to rediscover that at four o’clock. When a campaign goes live, stores should see it that morning. When collection volumes spike, the manager should know before the queue forms. When the floor finds a gap, head office should hear the same day rather than a week later in a sales report. That’s what task management is for at store level.
None of this makes a store faster at reacting. It makes the ordinary week light enough, and the store’s condition visible enough, that reacting is possible at all.
Getting people through the door is a marketing achievement. Being ready for them when they arrive is an operations one, and it lands on whoever is working that shift.
So give your teams the context the customer already has. Then the store stops being the last stop in a journey it cannot see, and becomes the place where the whole thing either works or doesn’t.
And when someone walks in on a Thursday asking for something from a video nobody has seen, your team already knows about it.
Gen Z shoppers want a store that already knows what they saw online. They research across social platforms, AI tools and marketplaces before they arrive, then visit a physical store for a specific reason: to check the color, confirm the fit, or take the item home the same day. That makes accurate stock, informed associates and fast fulfillment the things that decide whether the visit converts, rather than the things that happen after the sale.
What are the buying habits of Generation Z?
Generation Z buys across digital and physical channels within a single purchase rather than choosing one. Discovery usually starts on social platforms or an AI assistant, price gets checked against several retailers in the aisle, and the purchase itself may run through an app, a store, or both. Returns are frequently planned in advance, with 51% ordering multiple sizes or colors intending to send most of them back.
What exactly does “phygital” mean?
Phygital means physical and digital combined, describing a purchase that moves between both without the shopper treating them as separate channels. In retail it covers behaviors like researching online and buying in store, buying on an app and collecting locally, or returning an online order at a counter. For store operations the useful part of the definition is the handover, because each of those behaviors ends in a physical task for a store team.
What does store fulfillment mean?
Store fulfillment means using a physical store’s stock and staff to complete online orders instead of routing them through a distribution center. In practice that covers picking items from the sales floor, packing them, staging click and collect orders for handover, shipping directly from store, and processing returns at the counter. Colliers’ 2026 research reports that one in four online orders is now fulfilled this way.
How does click and collect affect store staff workload?
Click and collect adds unplanned work to a store day that was already scheduled around walk-in traffic. Each order needs picking from the sales floor, staging somewhere secure, and handing over at a counter, and none of that was on the task plan when labor was rostered two weeks earlier. Pick failures make it worse, because a missing item sends an associate searching the backroom and returns desk before the order can be cancelled or re-routed.
How do retailers keep store teams updated on online campaigns?
Retailers keep store teams updated by pushing campaign information to the same place the team already receives daily tasks, rather than relying on email or printed packs. That means a promotion going live online appears as a briefed, trackable task in store on the morning it launches, with head office able to see which sites acknowledged it. The alternative is an associate learning about a discount from the customer asking for it.
Service delis combine labor-intensive fresh-food work with strict food-safety controls. That combination puts execution under pressure whenever customer demand peaks.
TimeForge’s 2022 benchmark of independent and mid-sized U.S. grocers found Bakery/Deli sales per labor hour ranging from $42 in the Southeast to $200 in the West; TimeForge cautions that its sample skewed toward rural operators and should be treated as a baseline rather than a universal target. FMI reports a 2025 supermarket average of $217.83 in sales per labor hour. Sources: TimeForge 2022 grocery benchmark; FMI Food Industry Facts.
CDC EHS-Net research in 359 restaurants found that managers at 91.6% reported an internal date-marking policy. During on-site observations, data collectors saw at least one ready-to-eat TCS food date-marked in 77.2% of restaurants. Restaurants with an internal policy were observed date-marking 5.04 times as often as those without one. Source: EHS-Net date-marking study.
The slicer numbers are sharper. Under the FDA Food Code, food-contact surfaces used with TCS food generally must be cleaned at least every four hours, subject to defined exceptions. Across the EHS-Net deli study, 54.2% of interviewed workers reported fully cleaning slicers less frequently than every four hours. In a related 197-deli study, only 26.9% of workers reported both properly cleaning and inspecting slicers at that frequency. Sources: FDA Food Code 2022; CDC slicer cleaning study; CDC slicer inspection study.
INSIGHT
Policy is associated with better execution, but observed practice still lagged manager reports. The operational challenge is making each control easy to complete, verify and correct during a live shift.
The seven fixes below all work on timing, ownership and proof rather than on writing the standard down again. They assume the checks themselves are already digital rather than on paper.
1. Move routine checks out of peak trading windows
Peak periods vary by store, so map them from your own transaction, queue and staffing data rather than relying on a generic daypart template.
Move non-safety-critical routine work outside those windows, but do not move a regulated food-safety deadline beyond its required interval.
Under the FDA Food Code, food-contact surfaces used with TCS food generally must be cleaned at least every four hours, subject to defined exceptions. A slicer cleaned at 07:00 therefore reaches that interval at 11:00. Source: FDA Food Code 2022.
Blackout windows help by withholding non-essential tasks during known peak periods. Associates see only customer-facing and safety-critical work while the store is busy. Routine work returns when trade drops.
DEFINITION:
Task blackout window
A configured period that withholds non-essential tasks from frontline devices, so associates see only customer-facing or safety-critical work during peak trading. Routine tasks return when trade drops rather than disappearing.
Strand uses this approach across 261 stores, pairing a fixed weekly publishing rhythm with blackout periods that protect customer-facing hours. Source: Strand case study.
2. Trigger the right checks from the right signal
Not every counter task belongs on the same trigger. Regulated food-safety tasks must follow the standard that applies; other operational checks can be driven by usage or performance signals where appropriate.
For slicers used with TCS food, the FDA Food Code generally sets a four-hour cleaning interval, subject to defined exceptions. That means usage-based automation should never override a mandated safety interval. Source: FDA Food Code 2022.
A current YOOBIC customer example shows where usage-based triggering can make sense: Pilot Flying J’s deep-cleaning compliance audits trigger automatically every 150 showers across its travel-center network, replacing manual scheduling with a volume-based signal. Source: YOOBIC retail audit guide.
3. Route each task to the role that owns it
Most missed checks never reach the person who would have done them.
Morrisons and YOOBIC reported at Retail Technology Show 2026 that weekly task volumes fell from 80–100 items to approximately 10 targeted actions per manager, routed directly to the responsible colleague. Time savings were separately validated through internal time-and-motion studies. Source: Morrisons 2026 case study.
Café menu updates, for example, now go directly to café managers. Store and regional managers can monitor completion and focus on exceptions rather than manually distributing every instruction. Source: Morrisons 2026 case study.
“Productivity isn't about doing more. It's about removing friction so people can do their best work.”
Gordon Macpherson, Group Productivity Director, Morrisons
4. Cap what an associate sees at one time
A long list during a rush is the same as no list.
When service and multistep operational work compete for attention, frequent task switching creates avoidable cognitive load.
Controlled human-factors research shows why interruptions matter, even though the experiment was not conducted in retail delis.
Altmann, Trafton and Hambrick found that interruptions averaging 2.8 seconds doubled post-interruption sequence errors; interruptions averaging 4.4 seconds tripled them. Treat those figures as general interruption evidence, not deli-specific error rates. Source: Altmann et al., Journal of Experimental Psychology.
Role, location and format targeting narrows the list to what the person in front of you actually owns this shift. That is the same discipline behind retail task management anywhere else in the store.
5. Capture proof at the point of work
Paper or manually transcribed logs add opportunities for delayed entry and transcription error. A defensible monitoring record should show who checked, when the check happened and the actual result. Source: FSA MyHACCP Principle 4.
FSA MyHACCP guidance says monitoring records should include the date and time of the activity and the actual result, and should be reviewed by another nominated responsible person where possible. Source: FSA MyHACCP Principle 4.
Digital capture can remove manual transcription steps. At Morrisons, a Bluetooth probe writes the temperature directly into the task; if the reading falls outside the permitted range, the system triggers an automated alert and corrective action to the responsible manager. Source: Morrisons 2026 case study.
156 scheduled / 162 worked hours
In TimeForge’s 2022 sample, Bakery/Deli averaged 156 scheduled labor hours and 162 hours actually worked per store per week.
Source: TimeForge 2022 grocery benchmark.
6. Make a missed check produce an owner, not a gap
A missing entry in a folder tells you something failed. It does not tell you who is fixing it.
When monitoring shows that a critical limit has not been met, the response needs to be documented and assigned to someone with clear responsibility for corrective action. Source: FSA MyHACCP Principle 5.
The fix is escalation with a name attached. A missed or out-of-range check should create a corrective action with a clear owner and a documented outcome. At Morrisons, an out-of-range Bluetooth probe reading triggers an automated alert and corrective action to the responsible manager. Sources: FSA MyHACCP Principle 5; Morrisons 2026 case study.
7. Pair routine checks with verification
Monitoring tells you what was recorded. Verification checks whether the food-safety system is actually working in practice.
FSA MyHACCP guidance lists measurements, document audits, staff assessments, trend analysis and review of corrective actions among the activities businesses can use to verify a HACCP system. Source: FSA MyHACCP Principle 6.
For fresh-counter operations, that means supervisors should focus on exceptions, recurring failures and whether corrective actions were actually carried out, rather than simply checking that a box was ticked. Source: FSA MyHACCP Principle 6.
What a defensible compliance record looks like
The seven fixes above can generate a useful evidence trail for HACCP-based monitoring and corrective action, but inspection requirements depend on jurisdiction and on the business’s own food-safety management system. Source: FSA MyHACCP Principle 7.
In England, Wales and Northern Ireland, chilled food that needs temperature control must generally be kept at 8°C or below; FSA guidance recommends operating refrigerators at 5°C or below. Scotland uses a different legal framework for chilled food, while Food Standards Scotland recommends refrigeration at 5°C or below. Across the UK, hot-held food should be kept above 63°C, subject to defined exemptions and tolerances. Sources: UK chilled-food guidance; Food Standards Scotland CookSafe.
The evidence trail should follow the business’s HACCP-based system rather than a universal number of weeks of paperwork. FSA MyHACCP lists CCP monitoring activities, deviations and corrective actions, verification procedures and training records among the records a business may need, and says retention periods should be appropriate to the product and operation. Source: FSA MyHACCP Principle 7.
Natasha’s Law tightened requirements for food prepacked for direct sale: PPDS food must carry the food name and a full ingredients list with allergenic ingredients emphasised. Loose or non-prepacked deli food is treated differently: businesses must provide information on the 14 regulated allergens, which may be supplied in writing or verbally if a clearly visible notice explains how customers can obtain it. FSA best practice is written information supported by a conversation. Sources: FSA PPDS allergen guidance; FSA non-prepacked allergen guidance.
In the U.S., the FDA Food Code is a model code that jurisdictions may adopt. Section 3-501.17 provides that refrigerated ready-to-eat TCS food held for more than 24 hours should be date-marked and used, sold or discarded within seven calendar days at 5°C/41°F or less, with the day of preparation counted as day one. Source: FDA Food Code 2022.
Start with the timing
Fresh-counter compliance failures rarely come down to one thing. Standards, task timing, ownership, monitoring and verification all matter; operational risk rises when a required control competes with live service demand.
Map when your counter workload actually peaks. Move routine checks out of those windows. Route each one to the role that owns it, capture the evidence where the work happens, and make a missed check produce a name.
The same seven apply to butchery, fish and hot food. The timings differ. The collision does not. For the wider picture across the store, see our guide to grocery store operations.
Deli slicers used with TCS food generally need full cleaning at least every four hours under the FDA Food Code, subject to defined exceptions. Full cleaning means disassembling, cleaning and sanitizing the slicer; a surface wipe is not equivalent to full cleaning. In CDC EHS-Net research, 54.2% of interviewed workers reported full cleaning less frequently than every four hours, and a related study found only 26.9% reported both proper cleaning and inspection at that frequency. Sources: FDA Food Code 2022; CDC slicer cleaning study; CDC slicer inspection study.
Why do deli compliance checks get missed?
There is no single research-backed cause of missed deli checks. The strongest evidence points to execution risk rather than one universal failure mode: EHS-Net found a gap between manager-reported date-marking practice and observed practice, while controlled interruption research shows that even brief interruptions can increase sequence errors in multistep work. For deli teams, the practical response is to protect safety-critical tasks from unnecessary interruption, route them to a named owner and verify completion. Sources: EHS-Net date-marking study; Altmann et al., Journal of Experimental Psychology.
How can grocery stores improve food safety compliance at fresh counters?
Grocery stores can improve fresh-counter compliance by making ownership explicit, protecting safety-critical work from non-essential task noise, capturing monitoring results at the point of work, documenting corrective actions and verifying that the HACCP system is working in practice. EHS-Net found that restaurants with an internal date-marking policy were observed date-marking 5.04 times as often as restaurants without one; FSA MyHACCP guidance separately emphasizes monitoring, corrective action and verification. Sources: EHS-Net date-marking study; FSA MyHACCP guidance.
What does an environmental health officer check at a deli counter?
At a deli counter, an environmental health officer will assess the controls and records relevant to the business’s food-safety management system rather than apply a universal ‘two to four weeks’ rule. A defensible record can include monitoring results, deviations and corrective actions, verification activity and training records. In England, Wales and Northern Ireland, cold food that requires temperature control must generally be kept at 8°C or below, with FSA guidance recommending fridges at 5°C or below; Scotland uses a different chilled-food legal framework. Hot-held food should be kept above 63°C, subject to applicable exemptions and tolerances. Allergen information must also meet the rules for PPDS and non-prepacked foods. Sources: FSA MyHACCP Principle 7; FSA chilled-food guidance; Food Standards Scotland CookSafe; FSA allergen guidance.